
Page 19 - Human Environment Interface (3)
P. 19
Novel Fluorescent Probes for the Oxidative Milieu
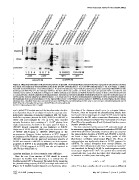
Figure 2. Oligomer formation of fluorescent proteins is specific. The indicated fluorescent proteins were expressed in cells and the cells were
then lysed and analyzed by immunoblotting using either anti-GFP antibody (lanes 1–8) or anti-RFP antibody (lanes 9–16). As in Figure 1, samples
were SDS-treated with (lanes 5–12) or without (lanes 1–4 and 13–16) reduction. ‘‘Cys:10 indicates fluorescent proteins containing C48S (SGFP2) or S3C
(mCherry) and SGFP2‘‘Cys:20 is the wild type SGFP2. In the lanes where two proteins are listed, both expression plasmids were cotransfected. Std:
molecular mass markers as indicated in the figure. As neither antibody cross-reacted and indeed showed no reaction in lane 6, then the band in lane
2 is assumed to be a leaked sample from the adjacent lanes. mCherry(Cys:1) formed a disulfide bonded dimer (lane14). Since the molecular masses of
SGFP2 and the mCherry oligomer are different (lane 1 or 5 versus lane 10 or 14), then heterooligomers consisting of SGFP2 and mCherry should be
distinguishable from each homooligomer. As the band profiles of lane 1 (SGFP2(Cys:1) alone) and lane 3 (SGFP2(Cys:1)+mCherry(Cys:1)) were almost
identical, then a disulfide bond was not formed between SGFP2(Cys:1) and mCherry(Cys:1). The same is true for lanes 14 (mCherry(Cys:1)) and 15
(SGFP2(Cys:1)+mCherry(Cys:1)) and lane 16 (SGFP2(Cys:2)+mCherry(Cys:1)).
doi:10.1371/journal.pone.0037551.g002
used a global PCH analysis protocol that simultaneously calculates bleaching of the oligomers should occur in a stepwise fashion.
time-dependent decay of correlation function for accurate time- However, when we measured the photobleaching kinetics from
indepepdent estimation of molecular brightness [28]. We beads- four hundred streaming images of a single SGFP2 molecule tightly
loaded the expression plasmids for EGFP, SGFP2 and cfSGFP2 in immobilized in the ER under evanescence illumination, at least
COS7 cells and incubated for 3 hr at 37uC, then recorded four molecules disappeared (Figure 4A). A kymograph of each spot
intensity fluctuation data consisting of 1–46106 photons from (Panel B) and its quantification (Panel C) showed that there was no
single measurements. As shown in the upper panel of Figure 3, stepwise photobleaching.
cfSGFP2 showed comparable in vivo brightness as SGFP2.
Brightness of EGFP (average 28831 cpsm) was lower than that This data indicated that fluorescent GFP molecules should all
of SGFP2 (38178 cpsm) or cfSGFP2 (39524 cpsm) in the be monomers, suggesting that fluorescent molecules of SGFP2 and
measurements. However, further incubation at 28uC increased cfSGFP2 should behave identically. However, when we compared
the brightness of EGFP (38727 cpsm) to the same level as SGFP2/ the autocorrelation function of SGFP2 and cfSGFP2 in the ER,
cfSGFP2, suggesting that the improved maturation property of we found a large difference in the decay profile of FCS
SGFP2 was retained in cfSGFP2. In addition, one of the superior (fluorescence correlation spectroscopy) (Figure 5A). Decay of
properties of SGFP2 is its photostability [24]. This stability of autocorrelation was significantly slower in SGFP2 compared to
SGFP2 (1.7-fold compared to EGFP) was also not impaired in cfSGFP2. To analyze divergence from normal diffusion, we
cfSGFP2 (2.0-fold) (Table 1). considered three diffusional models. First, ‘‘anomalous exponents’’
was introduced for fitting [4,29,30]. In nonhomogeneous media,
Cysteine Residues in SGFP2 Restrict Free Diffusion mean square displacement ,Dr2. of a particle does not linearly
Since the core b-can structure of GFP should be severely expand with time t very often but rather, their relationship could
be assumed to exhibit power law scaling with
damaged by disulfide bond formation, it is unlikely that the
disulfide bonded GFP is fluorescent. We tested this by measuring vDr2 w~C ta ð1Þ
the photobleaching property of SGFP2 at a single molecular level
(Figure 4). If disulfide-bonded oligomers are fluorescent, photo- where C is a factor usually referred to as the transport (diffusion)
PLoS ONE | www.plosone.org 3 May 2012 | Volume 7 | Issue 5 | e37551