
Page 20 - Human Environment Interface (3)
P. 20
Novel Fluorescent Probes for the Oxidative Milieu
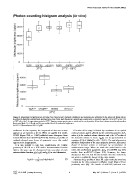
Figure 3. Molecular brightness of cysteine-free fluorescent variants. Brightness per molecule was estimated in the cytosol of living cells as
described in Materials and Methods, and plotted as box charts. Each fluorescent protein was expressed in a chamber stage for 3 hr at 37uC or for 3 hr
at 28uC after the 3 hr expression period at 37uC. Twenty measurements were carried out for each protein. A box chart shows mean (cross), median
(horizontal line), 25–75 (box) and 95 percentiles (bars) of molecular brightness.
doi:10.1371/journal.pone.0037551.g003
coefficient. In this equation, the magnitude of aberrant motion If motion of the cargo is limited by membranes in an optical
appears as an exponent a (a,1). When we applied this model, confocal volume, gi(t) is affected by the confined parameter, di/ri,
SGFP2 (Figure S1A, a = 0.667) exhibited more divergence from where di is the confined volume diameter and ri the 1/e2-radius of
normal diffusion than cfSGFP2 (a = 0.792). However, as profiles of the detection volume in i-axis. Gxyz(t) can be approximated as
residuals showed some forms of systematic error, this model equations (3–6) of Methods for di/ri #8 [31]. The optical geometry
appears to be inappropriate. should be independent of the cargo property; however, di becomes
shorter if luminal volume is narrowed by accumulation of
It is also possible to take into consideration the realistic nonfluorescent cargo. When we made this model fitted to the
geometry of the ER as a FCS model. Autocorrelation function curve, the confinement parameter, dy/rxy of ss-SGFP2 was 23%
G(t) in the space can be decomposed into a product of each smaller than ss-cfSGFP2 (Figure S1B). However, the larger
autocorrelation function gx(t), gy(t) and gz(t) in axial dimension, divergences from the best fits also indicate that this model does
not seem to explain the feature of the cargo motion.
1 ð2Þ
Gxyz(t)~ vNw gx(t)gy(t)gz(t) Aberrant decay profiles of these ER cargo molecules were best
resolved by the three-component diffusion model (Figure 5B) as
previously used [32]. The best-fit of ss-SGFP2 indicated one-
PLoS ONE | www.plosone.org 4 May 2012 | Volume 7 | Issue 5 | e37551