
Page 21 - Human Environment Interface (3)
P. 21
Novel Fluorescent Probes for the Oxidative Milieu
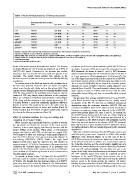
Table 1 Photo-chemical properties of fluorescent proteins.
Excitation/emission maxima eb Brightness
(mM21cm21)
(nm) QYa (nm) QY6e pKa t c (in vivo)
leach
37
EGFP 489/510 0.67 (460) 55 31 in vivod 5.4 1
SGFP2 497/517 0.77 (460) 40 34 5.4 1.7
cfSGFP2 493/517 0.75 (460) 45 46 28831 5.4 2.0
TagRFP 556/585 0.51 (520) 90 36 38178 3.1 1
cgfTagRFP 555/584 0.42 (520) 86 25e 39524 2.9 0.9
mKate2 586/633e 0.40e 63e 26 28198 5.4e 1.7
cgfmKate2 584/628 0.47 (530) 55 39532 4.6 1.4
22297
24441
aAbsolute quantum yield corrected with reabsorption and reemission (the excitation maximum in parentheses).
bExtinction coefficient measured with the absorbance maximum.
cPhotostability. Time to bleach 1/e of fluorescence relative to EGFP (SGFP2, cfSGFP2) or TagRFP expressed in COS7 cells (cgfTagRFP, mKate2 and cgfmKate2).
dPhoton counts per second per molecule (cpsm) of fluorescent proteins in COS7 cells at 37uC (Figure 3).
eCited literature ([41]).
doi:10.1371/journal.pone.0037551.t001
fourth of molecules showed aberrantly slow motion. The fraction membrane proteins can only be resolved by SDS-PAGE if heated
of simple diffusion (t = 0.137 msec) was improved up to 84% in at a higher temperature [35], we increased the temperature for the
cfSGFP2 (left panel). Compared to the previous two models, SDS treatment. As shown in lanes 11 and 15, 95uC-treatment
divergence from the best-fits was very small and appears to be almost completely changed the aberrant pattern observed in lane 3
stochastic. The results clearly indicate that cysteine in the or 7, and produced a 58 kDa (arrow) and a 45 kDa band (*). The
fluorescent protein contributes to the generation of slowly diffusing size of the larger band was identical to the mass of the ss-cfSGFP2-
populations. prion fusion protein and the smaller band was also visible in lane
10. A mutant SGFP2(C48S) did not improve the aberrant pattern
In contrast, most of the thiols are intact in the cytoplasm due to although the extent of higher molecular weight oligomers were
the low redox potential. However, there are classes of enzymes reduced (lanes 4 and 8). This result strongly indicates that even a
which react directly with thiols, such as thioredoxin [33]. They single cysteine residue in SGFP2 could interact with the prion
regulate various biological processes by catalyzing disulfide bonds polypeptide during folding and form an unusually stable compact
[34]. We thus considered the possibility that perhaps the cysteine structure.
residues of GFP may disturb normal diffusion in the cytoplasm.
When we compared normalized autocorrelation curves (Figure We speculated that perhaps misfolded forms of the ss-cfSGFP2-
S2A), decay profiles containing a time domain (centered at 0.3– prion fusion proteins may be disposed by the quality control
0.4 msec) showed a small but statistically significant difference mechanism of the ER. To this end, we inhibited proteasomal
(Panels A and B). This would not be due to the outlier since the degradation using the tri-leucine derivative, MG132 [36] and
difference was observed both in mean and median (Panel A). examined if misfolded forms of the fusion proteins accumulated.
Fitting revealed that elimination of cysteine significantly reduced However, no apparent change was observed in the ss-cfSGFP2-
the aberrantly diffusing populations (Panel C). prion fusion protein (Figure 6B, lanes 3 and 11). In contrast, for
the ss-SGFP2-prion fusion protein the same set of faster migrating
Effect of Cysteine Residues in a Tag on Folding and bands as observed by 70uC SDS treatment was observed by a
Targeting of a Fusion Protein 95uC treatment in the MG132-treated cells (arrowhead, lane13).
Since they were not present in the absence of MG132 treatment
When a protein tag is genetically fused to a protein of interest, (lane 14), then these must be disulfide-bonded misfolded forms that
the tag should not disturb the structure of the fused protein. are highly resistant to SDS and usually disposed by ER-associated
However, in some cases, tagging could severely interfere with the degradation.
proper folding of the protein. When prion, a GPI-anchored
protein, was fused to ss-SGFP2, we obtained an unusual SDS- When the cellular localizations of ss-cfSGFP2-prion protein and
PAGE pattern in either non-reducing or reducing gels (Figure 6A, ss-SGFP2-prion protein were compared in COS7 cells, marked
lanes 3 and 7). In this case, there was no obvious large oligomer in differences were observed (Figure 7). In the case of the ss-
non-reducing SDS-PAGE (-DDT). Rather, the major band cfSGFP2-prion fusion, the fluorescence signal was clearly observed
migrated much faster than the expected size and showed an at the plasma membrane in addition to a concentrated region at
apparent mass of ,42 kDa. In this construct, a fluorescent protein the Golgi-like structure and the overall pattern (middle) was very
containing the cleavable signal sequence of a1-antitrypsin was similar to the immunofluorescence pattern obtained by incubation
joined to the N-terminus of the mature prion protein at R25 since with anti-GFP antibody (bottom). The only difference was in the
prion contains a GPI-anchoring domain at its C-terminus and a region of the Golgi where autofluorescence was intense but lacked
cleavable signal sequence. the GFP antibody signal. This could be explained by steric
hindrance of the ss-cfSGFP2-prion fusion protein due to its
In contrast, as shown in lane 2 of Figure 6A, the ss-cfSGFP2- extensive concentration at the Golgi region such that the antibody
fused prion protein migrated normally on a gel at its expected size had no access to the fusion protein. In contrast, cell surface
of 58 kDa. We thought that the aberrant pattern of ss-SGFP2- labeling of prion protein fused to ss-SGFP2 was very poor and the
prion may have been caused by formation of a SDS-resistance cell surface image was barely observed (right panels). In this case,
compact structure in the fusion protein. As it is known that some
PLoS ONE | www.plosone.org 5 May 2012 | Volume 7 | Issue 5 | e37551