
Page 48 - Human Environment Interface (3)
P. 48
Learning Intermittent Strategy
Continuous Type One-sided Intermittent Type Two-sided Intermittent Type
Subject 4 Trial 14
Subject 2 Trial 27 Subject 9 Trial 29
100
100 100
10−2 10−2 10−2
PSD [rad2/Hz]
10−4 PSD [rad2/Hz]10−4 10−4
PSD [rad2/Hz]
10−6 10−6 10−6
SlopLow:−0.42838 SlopLow:−0.93 SlopLow:−1.0604
SlopHigh:−6.1971 SlopHigh:−6.1963 SlopHigh:−5.8397
10−8 10−8 15 10−8
0.01 0.1 15 0.01 0.1 0.01 0.1 15
Freq [Hz] Freq [Hz] Freq [Hz]
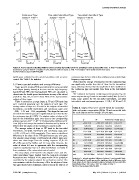
Figure 9. Power spectral density (PSD) functions of sway dynamics (h) of the pendulum during successful trials. A: Trial 14 of Subject 4
(continuous type). B: Trial 27 of Subject 2 (one-sided intermittent type). C: Trial 29 of Subject 9 (two-sided intermittent type).
doi:10.1371/journal.pone.0062956.g009
saddle point exhibited by the inverted pendulum with no active continuous type did not exhibit slow oscillations, but included high
control. See Table 3 for statistics. frequency components.
3.5 Power spectral analysis and energy efficiency Notice that the average of total power for the continuous type
Power spectral density (PSD) was estimated for every successful was significantly smaller than that of those for the intermittent
types, reflecting the fact that the amplitude of slow oscillation in
trial. Slopes (scaling factors) at the low and the high frequency the continuous type was smaller than those in the intermittent
bands (LF and HF) of the log-log plotted PSD were calculated to types.
characterize the double power-law behavior in sway of the virtual
pendulum. Figs. 9A, B and C show PSDs of the representative We estimated mechanical energies (powers) consumed by the
subjects of three types. active torques during F5 and the successful trials (Table 4). For F5
trials, mean powers for the two-sided intermittent, one-sided
Table 4 summarizes average slopes at LF and HF bands that intermittent and continuous types were 1:3 W, 1:69 W and 2:81
were examined separately over the subjects of each type. The
average values of slope at LF band for the subjects of two-sided Table 4. Slopes of PSD at LF and HF bands for successful
intermittent, one-sided intermittent and continuous types were trials and power consumption [W] for F5 and successful trials
20.99, 21.31 and 20.41, respectively. The slopes for two and for each subject and for average of each type.
one-sided intermittent types were significantly steeper than that for
the continuous type (pv0:05). The absolute values of slope at LF LF HF Power (F5) Power (Succ)
band in the intermittent types were close to the corresponding
scaling exponent of b~1:5 (H~0:25) reported by Collins and De S1 20.9660.45 25.8460.32 1.0860.12 0.3660.13*
Luca [52] in their two-point correlation functions and by Asai et al S9 0.6160.21
[32] in their simulation of the intermittent control model. two-int 21.0360.16 26.0560.33 1.5360.16 0.4760.13[c]
S2 0.2760.11
The average values of slope at HF band in the two-sided S3 20.9960.19{c} 25.9260.19 1.3060.11 0.2760.37*
intermittent, one-sided intermittent and continuous types were S5 0.2360.57
25.92, 25.99 and 25.63, respectively. There were no significant S8 21.1160.70 26.1760.10 0.7760.08 0.1360.96
differences in the slope of the HF band between any two types. one-int 0.2260.31[c]
The absolute values of slope at HF band in all of three types were S4 21.2360.23 26.5160.64 2.2560.29 1.5460.22
about two times larger than the scaling exponent of b~2:6 S7 0.8460.55
(H~0:8) reported by Collins and De Luca [52]. However, the S11 21.3560.27 25.5160.32 1.3160.51 1.1660.35*
value of about 6.0 was in agreement with the corresponding cont 1.2860.20[t][o]
exponent reported by Asai et al [32] and Nomura et al [53] in 21.5460.48 25.9460.45 2.4460.74
their simulation of the intermittent control model.
21.3160.14{c} 25.9960.14 1.6960.25
The steep slopes at LF band for the subjects of one and two-
sided intermittent types implied that the long-term-correlated 20.2060.37 25.8060.39 2.6460.28
fluctuations were included in the sway motion of the pendulum
controlled by the subjects adopted the intermittent control. This 20.9060.52 25.3560.72 2.8560.49
was consistent with the fact that sway of h in the subjects of those
two types showed slow oscillations, whereas that in the subjects of 20.1660.99 25.6760.57 2.9660.27
20.4160.13{t}{o} 25.6360.13 2.8160.20
Symbols of à indicate significant difference between F5 and successful trials
(pv0:01). Brackets [ ] and {} represent the significance levels of difference in the
mean values of each index among three types of strategies for successful trials,
respectively with pv0:01 and pv0:05. See caption of Table 3.
doi:10.1371/journal.pone.0062956.t004
PLOS ONE | www.plosone.org 15 May 2013 | Volume 8 | Issue 5 | e62956