
Page 46 - Human Environment Interface (3)
P. 46
Learning Intermittent Strategy
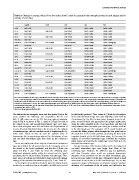
Table 3. Changes in average values of the five indices from F5 trials to successful trials through learning for each subject and for
average of each type.
S1-F5 InactR DCR QR Dis SD
S1-SC 0.4860.01
S9-F5 0.6660.03 0.4660.03 0.2360.05 0.03560.002 0.03860.002
S9-SC 0.5860.03 0.4760.03[c] 0.5060.05* 0.02260.002* 0.02460.002*
two-int-F5 0.6360.01 0.4660.03 0.0760.02 0.03560.002 0.04460.002
two-int-SC 0.5560.02 0.4160.04 0.4960.03{ 0.03060.002 0.03560.003
S2-F5 0.6560.02 0.3460.10 0.1560.03 0.03560.002 0.04160.002
S2-SC 0.5760.02*[o][c] 0.5160.01 0.5060.05{[o][c] 0.02560.002{ 0.02960.002{[o][c]
S3-F5 0.5960.03 0.4260.03[c] 0.3660.10 0.03260.004 0.03660.002
S3-SC 0.4260.03{ 0.1660.07 0.9060.12 0.04660.005 0.01160.003{
S5-F5 0.6060.02 0.3460.05 0.1460.04 0.03660.003 0.04460.003
S5-SC 0.3860.03{ 0.1660.04 0.8060.05{ 0.02260.004 0.01360.003{
S8-F5 0.4260.01 0.2260.02[t][o] 0.4660.08 0.019060.002 0.02660.003
S8-SC 0.4060.02 0.6760.09{ 0.013260.003 0.00860.003*
one-int-F5 0.4860.04 0.2260.06 0.032360.003 0.03960.003
one-int-SC 0.4560.05 0.6860.08 0.032760.004 0.01160.004*
S4-F5 0.5260.02 0.3060.04 0.03060.003 0.03660.001
S4-SC 0.4160.02{[t][c] 0.7660.03{[t][c] 0.02760.003 0.01160.002{[t](c)
S7-F5 0.2560.01 0.2060.05 0.02560.003 0.03260.002
S7-SC 0.1560.01{ 0.2460.04 0.01760.002 0.01760.002{
S11-F5 0.3160.02 0.2560.04 0.03460.004 0.04060.005
S11-SC 0.2060.02 0.2960.04 0.02460.004 0.01360.005*
cont-F5 0.4760.01 0.1560.03 0.03260.002 0.04260.003
cont-SC 0.2660.02{ 0.2760.04 0.01560.003{ 0.01860.003*
0.3460.02 0.2060.02 0.03160.002 0.03860.002
0.1960.02{[t][o] 0.2660.03[t][o] 0.01960.002{ 0.01660.002{[t](o)
(See text for definition of three types.) Significance levels of changes in the indices from F5 to successful trial were tested for each subject and for each of types. Symbols
{ and à represent that the value of the corresponding index changed significantly with pv0:001 and pv0:01, respectively. Parentheses () and brackets [ ] represent the
significance levels of difference in the mean values of each index among three types of strategies only for successful trials, respectively with pv0:01 and pv0:001. For
example, an index-value x for the one-sided intermittent type (one-int) denoted as ‘‘[t](c)’’means that the index-value x was significantly different from the
corresponding index-value for the two-sided intermittent type (two-int) with pv0:001, and it was significantly different from the corresponding index-value for the
continuous type with pv0:01.
doi:10.1371/journal.pone.0062956.t003
We defined the two triangular areas such that points (h,v) in the (or the fourth) quadrant. Thus, values of Q-Ratio for the subjects
areas satisfied the following two inequalities; hvv0 and of one-sided intermittent type were quite large (Fig. 7 and Table 3).
jvjvj{ahj, where we set a~3:0. See gray colored triangular As confirmed by Fig. 8E, the state point, departed from the off-
areas in Fig. 8. As shown in Fig. 7, values of Q-Ratio for most of point, moved forward and approached the upright saddle point
the subjects in one and two-sided intermittent types were large. along the stable manifold in the second quadrant, and then fell
Since these triangular areas did not include the neighborhood of away backward from the saddle point along the unstable manifold
v-axis, off-points distributed close to the v-axis, as in the subjects in the third quadrant. The activation of TA muscle braked and
of continuous type, did not contribute much to heightening the Q- reversed the falling motion, which brought the state point back to
Ratio value. Based on this, we used the Q-Ratio value to the small area in the second quadrant, generating the slow cyclic
discriminate the timing-strategy adopted by the subjects of one trajectory located at the left-half phase plane. In this way, the
and two-sided intermittent types from those by the continuous subjects of one-sided intermittent type exhibited the transient
type. stable motion generated by the saddle-type vector field as in the
two-sided intermittent type.
In the successful trials of the subjects of two-sided intermittent
type, about half of the off-points located in the triangular areas of Average Dis-values of the localized off-points for the subjects of
the second or the fourth quadrants, and thus the Q-Ratio was one-sided intermittent type were larger than those of the
about 0.5 (Fig. 7 and Table 3). Since the off-points were continuous type. However, the difference was not significant,
distributed relatively widely within the second and the fourth and thus, Dis-value alone could not uniquely characterize
quadrants, the Dis-values of those off-points were also large. Thus, dynamics of the pendulum for the one-sided intermittent type,
large values of Q-Ratio and Dis indices characterized the timing- because for some subjects of this type, off-points localized at small
strategy of the two-sided intermittent type (Fig. 7 and Table 3). areas closer to the v-axis as in the continuous type. So, we also
quantified a degree of localization of off-points using the standard
In the subjects of one-sided intermittent type, the off-points were deviation of h-coordinates of the off-points, and referred to this
localized in a small area close to the stable manifold at the second
PLOS ONE | www.plosone.org 13 May 2013 | Volume 8 | Issue 5 | e62956