
Page 17 - Human Environment Interface (4)
P. 17
Brain Reading for Human-Machine Interfaces
windows were used for training. Since movement intention is which we could not be certain (for each single trial) whether or not
neither locked to a certain stimulus (i.e., command) nor happens the brain was already preparing a movement. Sliding windows
after a fixed time of delay, it is necessary to continuously analyze the ending in this time interval were left out for performance calculation.
EEG stream during test. This continuous analysis is based on a Also, predictions based on windows ending at {150 to 0 ms (see
sliding window approach, i.e., a window of a fixed length is Fig. 13) were excluded due to the fact that the actual movement onset
extracted every 50 ms from the EEG stream. happens before the movement marker is stored (see estimation of
movement onset in Sec. ‘‘sec:ArmrestResultsBehavior’’).
For offline evaluation, an approach similar to the one presented
in [54] was chosen: Windows for the movement preparation class had a Since the training windows overlapped in time, similar
length of 1000 ms and were cut out with respect to the movement performances for consecutive windows were expected. Hence,
marker. For training, 13 different windows were analyzed for that overlapping windows were analyzed for each subject in order to
class that ended between {600 to 0 ms relative to the movement find points in time which lead to significantly different perfor-
marker, i.e., [{1600, {600], [{1550, {550], [{1000, 0]. mances to define borders of clusters. To evaluate which combina-
Training windows for the no movement preparation class were cut out tion of two training windows is optimal, performance of all
every 1000 ms, if no other marker was stored in the data stream possible combinations of two training windows were computed,
1000 ms before or 2000 ms after that window. Since the duration i.e., combinations within the same cluster and between clusters.
of a rest period was not fixed, the number of instances per data set The mean performance of all within – cluster combinations and all
differed for that class (from 359 to 520). For testing, sliding between-cluster combinations for each defined cluster, the mean
windows were cut out every 50 ms in the range from {4000 to performances of the single training windows in each cluster, and
0 ms. Data processing in both cases (training and test) was done as the performance of all training windows were finally compared
follows: All trials were standardized (m~0, s~1), decimated to 20 using repeated measures ANOVA with combination (10 levels) as a
Hz and band pass filtered (0:1–4:0 Hz). Only the last 200 ms were within-subjects factor. Here, performance for all 13 training
used for feature generation: 124 channels |4 time points ~496 windows served as a baseline, representing the case that no specific
features. Finally, a SVM was trained on the feature vectors of the training windows were chosen.
training data. In each training run, SVM parameters were
optimized with an internal 5-fold cross validation using a pattern Results
search algorithm [69]. Behavior. In the whole experiment, subjects responded in
For classifier evaluation, a 5|2-fold cross validation was used for total to 720 target stimuli and missed 33 target stimuli (mean and
each subject on the merged data of one session (3 concatenated sets). standard deviation across subjects for omission errors: 8:25+2:63).
To calculate a performance measure (BA), labeling of the sliding This low amount of omission errors, i.e., missed targets, was expected
windows was required. Since the onset of the LRP cannot exactly be due to the low effort of the main task. In total 7 commission errors
determined for single trials (see explanations given above), we on standard stimuli occurred (subject 2: 1 commission error,
defined a time range from {600 to {350 ms based on average ERP subject 4: 6 commission errors). The response time was on average
analysis (see Fig. 13) as an uncertain area, i.e., as a time range in 4:7 sec (mean of subject’s median), with a median minimal
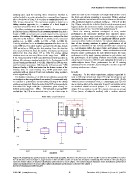
Figure 14. Classification performance in the Armrest scenario. Results for the performance of the classifier trained in the dual BR scenario for
the classification of missed target vs. target instances after classifier transfer are shown for all subjects individually. The red lines in the main diagram
mark the median values of obtained classification performance for each subject. The inserted diagram illustrates mean classification performance
values and standard error of mean (SEM). Highest classification performance is observed for subject 1.
doi:10.1371/journal.pone.0081732.g014
PLOS ONE | www.plosone.org 15 December 2013 | Volume 8 | Issue 12 | e81732