Page 107 - Applied Statistics with R
P. 107

7.3. DECOMPOSITION OF VARIATION                                   107


                                SSReg (Sum of Squares Regression)    SSE (Sum of Squares Error)
                         25                                 25

                         20                                 20

                         15                                 15
                       y                                  y
                         10                                 10

                         5                                  5

                         0                                  0
                           0    2     4    6    8    10      0     2    4    6     8    10
                                        x                                  x
                                  SST (Sum of Squares Total)         SST (Sum of Squares Total)
                         25                                 25
                         20                                 20

                         15                                 15
                       y                                  y
                         10                                 10

                         5                                  5

                         0                                  0
                           0    2     4    6    8    10      0     2    4    6     8    10
                                        x                                  x


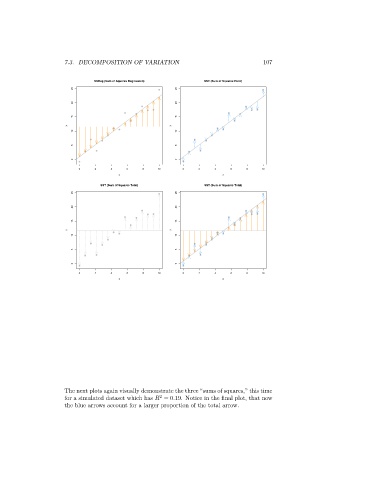
                      The next plots again visually demonstrate the three “sums of squares,” this time
                                                      2
                      for a simulated dataset which has    = 0.19. Notice in the final plot, that now
                      the blue arrows account for a larger proportion of the total arrow.
   102   103   104   105   106   107   108   109   110   111   112