
Page 306 - Applied Statistics with R
P. 306
306 CHAPTER 14. TRANSFORMATIONS
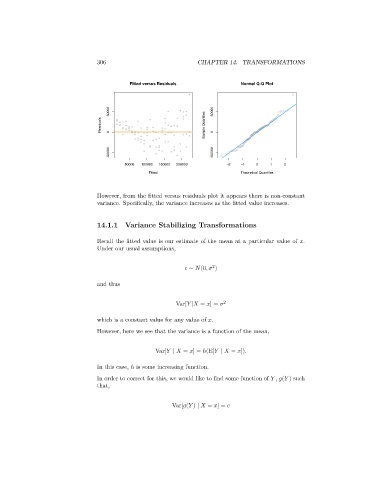
Fitted versus Residuals Normal Q-Q Plot
50000 50000
Residuals 0 Sample Quantiles 0
-50000 -50000
50000 100000 150000 200000 -2 -1 0 1 2
Fitted Theoretical Quantiles
However, from the fitted versus residuals plot it appears there is non-constant
variance. Specifically, the variance increases as the fitted value increases.
14.1.1 Variance Stabilizing Transformations
Recall the fitted value is our estimate of the mean at a particular value of .
Under our usual assumptions,
2
∼ (0, )
and thus
Var[ | = ] = 2
which is a constant value for any value of .
However, here we see that the variance is a function of the mean,
Var[ ∣ = ] = ℎ(E[ ∣ = ]).
In this case, ℎ is some increasing function.
In order to correct for this, we would like to find some function of , ( ) such
that,
Var[ ( ) ∣ = ] = 