
Page 308 - Applied Statistics with R
P. 308
308 CHAPTER 14. TRANSFORMATIONS
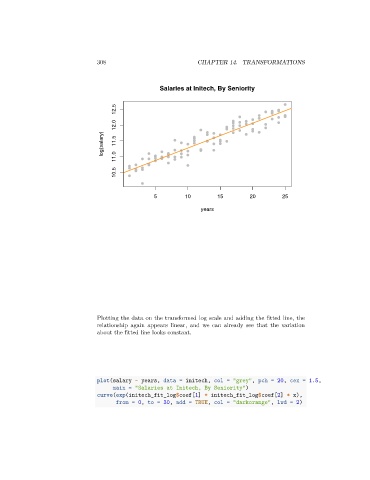
Salaries at Initech, By Seniority
12.5
12.0
log(salary) 11.5
11.0
10.5
5 10 15 20 25
years
Plotting the data on the transformed log scale and adding the fitted line, the
relationship again appears linear, and we can already see that the variation
about the fitted line looks constant.
plot(salary ~ years, data = initech, col = "grey", pch = 20, cex = 1.5,
main = "Salaries at Initech, By Seniority")
curve(exp(initech_fit_log$coef[1] + initech_fit_log$coef[2] * x),
from = 0, to = 30, add = TRUE, col = "darkorange", lwd = 2)