
Page 309 - Applied Statistics with R
P. 309
14.1. RESPONSE TRANSFORMATION 309
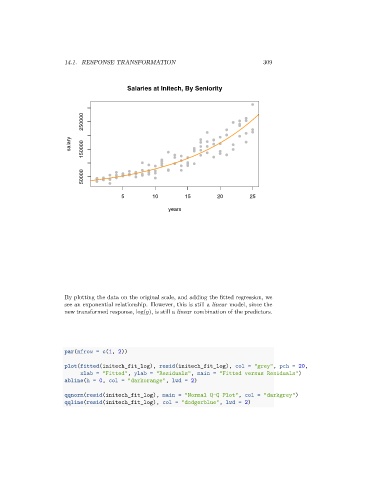
Salaries at Initech, By Seniority
250000
salary 150000
50000
5 10 15 20 25
years
By plotting the data on the original scale, and adding the fitted regression, we
see an exponential relationship. However, this is still a linear model, since the
new transformed response, log( ), is still a linear combination of the predictors.
par(mfrow = c(1, 2))
plot(fitted(initech_fit_log), resid(initech_fit_log), col = "grey", pch = 20,
xlab = "Fitted", ylab = "Residuals", main = "Fitted versus Residuals")
abline(h = 0, col = "darkorange", lwd = 2)
qqnorm(resid(initech_fit_log), main = "Normal Q-Q Plot", col = "darkgrey")
qqline(resid(initech_fit_log), col = "dodgerblue", lwd = 2)