
Page 317 - Applied Statistics with R
P. 317
14.1. RESPONSE TRANSFORMATION 317
-46 95%
-48
log-Likelihood -50 -52
-54
-56
-58
-0.2 0.0 0.2 0.4 0.6
λ
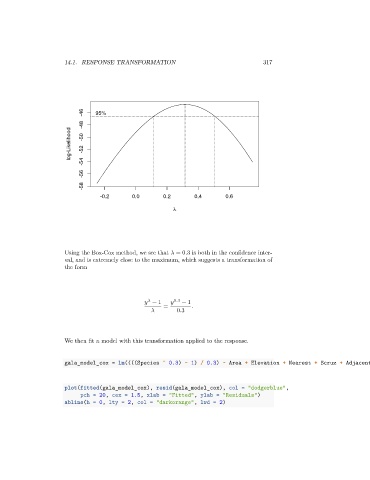
Using the Box-Cox method, we see that = 0.3 is both in the confidence inter-
val, and is extremely close to the maximum, which suggests a transformation of
the form
− 1 0.3 − 1
= .
0.3
We then fit a model with this transformation applied to the response.
gala_model_cox = lm((((Species ^ 0.3) - 1) / 0.3) ~ Area + Elevation + Nearest + Scruz + Adjacent, data = gala)
plot(fitted(gala_model_cox), resid(gala_model_cox), col = "dodgerblue",
pch = 20, cex = 1.5, xlab = "Fitted", ylab = "Residuals")
abline(h = 0, lty = 2, col = "darkorange", lwd = 2)