
Page 313 - Applied Statistics with R
P. 313
14.1. RESPONSE TRANSFORMATION 313
-50 95%
-100
log-Likelihood -150
-200
-2 -1 0 1 2
λ
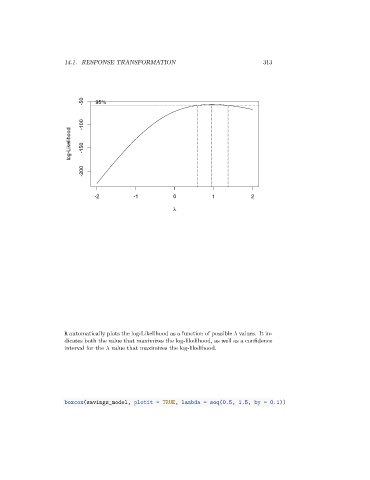
R automatically plots the log-Likelihood as a function of possible values. It in-
dicates both the value that maximizes the log-likelihood, as well as a confidence
interval for the value that maximizes the log-likelihood.
boxcox(savings_model, plotit = TRUE, lambda = seq(0.5, 1.5, by = 0.1))