
Page 314 - Applied Statistics with R
P. 314
314 CHAPTER 14. TRANSFORMATIONS
-57.0
log-Likelihood -58.0 -59.0 95%
-60.0
0.6 0.8 1.0 1.2 1.4
λ
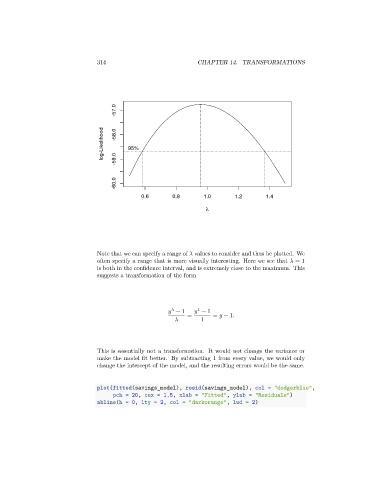
Note that we can specify a range of values to consider and thus be plotted. We
often specify a range that is more visually interesting. Here we see that = 1
is both in the confidence interval, and is extremely close to the maximum. This
suggests a transformation of the form
1
− 1 = − 1 = − 1.
1
This is essentially not a transformation. It would not change the variance or
make the model fit better. By subtracting 1 from every value, we would only
change the intercept of the model, and the resulting errors would be the same.
plot(fitted(savings_model), resid(savings_model), col = "dodgerblue",
pch = 20, cex = 1.5, xlab = "Fitted", ylab = "Residuals")
abline(h = 0, lty = 2, col = "darkorange", lwd = 2)