Page 315 - Applied Statistics with R
P. 315

14.1. RESPONSE TRANSFORMATION                                     315


                             10


                             5
                        Residuals  0


                             -5


                                   6         8        10        12        14         16

                                                         Fitted


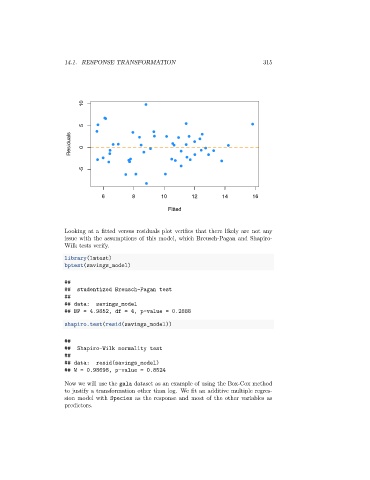
                      Looking at a fitted versus residuals plot verifies that there likely are not any
                      issue with the assumptions of this model, which Breusch-Pagan and Shapiro-
                      Wilk tests verify.

                      library(lmtest)
                      bptest(savings_model)


                      ##
                      ##   studentized Breusch-Pagan test
                      ##
                      ## data:   savings_model
                      ## BP = 4.9852, df = 4, p-value = 0.2888
                      shapiro.test(resid(savings_model))


                      ##
                      ##   Shapiro-Wilk normality test
                      ##
                      ## data:   resid(savings_model)
                      ## W = 0.98698, p-value = 0.8524
                      Now we will use the gala dataset as an example of using the Box-Cox method
                      to justify a transformation other than log. We fit an additive multiple regres-
                      sion model with Species as the response and most of the other variables as
                      predictors.
   310   311   312   313   314   315   316   317   318   319   320