
Page 350 - Applied Statistics with R
P. 350
350 CHAPTER 14. TRANSFORMATIONS
14.2.3 Overfitting and Extrapolation
sim_for_perf = function() {
x = seq(0, 10)
y = 3 + x - 4 * x ^ 2 + rnorm(n = 11, mean = 0, sd = 25)
data.frame(x, y)
}
set.seed(1234)
data_for_perf = sim_for_perf()
fit_correct = lm(y ~ x + I(x ^ 2), data = data_for_perf)
fit_perfect = lm(y ~ x + I(x ^ 2) + I(x ^ 3) + I(x ^ 4) + I(x ^ 5) + I(x ^ 6) +
I(x ^ 7) + I(x ^ 8) + I(x ^ 9) + I(x ^ 10),
data = data_for_perf)
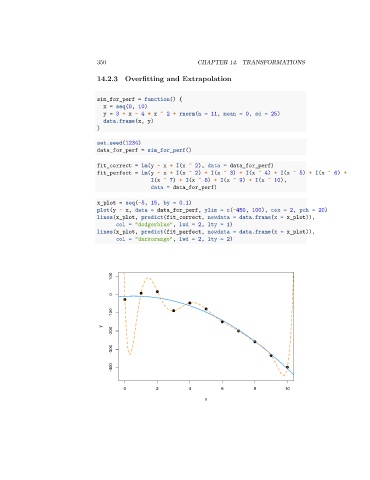
x_plot = seq(-5, 15, by = 0.1)
plot(y ~ x, data = data_for_perf, ylim = c(-450, 100), cex = 2, pch = 20)
lines(x_plot, predict(fit_correct, newdata = data.frame(x = x_plot)),
col = "dodgerblue", lwd = 2, lty = 1)
lines(x_plot, predict(fit_perfect, newdata = data.frame(x = x_plot)),
col = "darkorange", lwd = 2, lty = 2)
100
0
-100
y
-200
-300
-400
0 2 4 6 8 10
x