
Page 351 - Applied Statistics with R
P. 351
14.2. PREDICTOR TRANSFORMATION 351
14.2.4 Comparing Polynomial Models
sim_higher = function(sample_size = 250) {
x = runif(n = sample_size, min = -1, max = 1) * 2
y = 3 + -6 * x ^ 2 + 1 * x ^ 4 + rnorm(n = sample_size, mean = 0, sd = 3)
data.frame(x, y)
}
2
= + + +
1
2
0
2
4
3
= + + + + +
0
4
3
2
1
3
2
4
6
5
= + + + + + + +
5
0
4
3
1
2
6
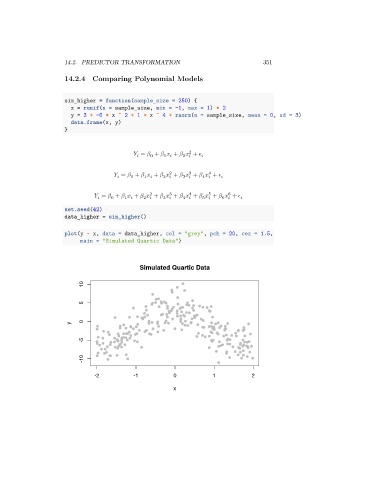
set.seed(42)
data_higher = sim_higher()
plot(y ~ x, data = data_higher, col = "grey", pch = 20, cex = 1.5,
main = "Simulated Quartic Data")
Simulated Quartic Data
10
5
0
y
-5
-10
-2 -1 0 1 2
x