
Page 45 - Applied Statistics with R
P. 45
3.2. DATA STRUCTURES 45
dim(example_data)
## [1] 10 3
The data.frame() function above is one way to create a data frame. We can
also import data from various file types in into R, as well as use data stored in
packages.
The example data above can also be found here as a .csv file. To read this
data into R, we would use the read_csv() function from the readr package.
Note that R has a built in function read.csv() that operates very similarly.
The readr function read_csv() has a number of advantages. For example, it
is much faster reading larger data. It also uses the tibble package to read the
data as a tibble.
library(readr)
example_data_from_csv = read_csv("data/example-data.csv")
This particular line of code assumes that the file example_data.csv exists in a
folder called data in your current working directory.
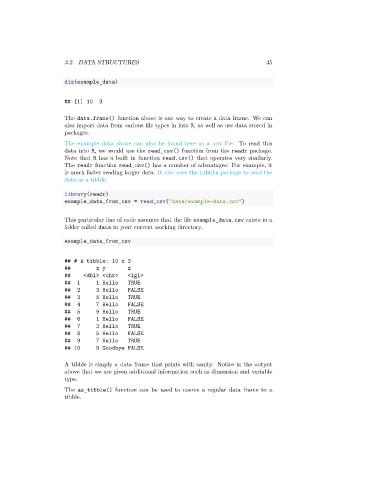
example_data_from_csv
## # A tibble: 10 x 3
## x y z
## <dbl> <chr> <lgl>
## 1 1 Hello TRUE
## 2 3 Hello FALSE
## 3 5 Hello TRUE
## 4 7 Hello FALSE
## 5 9 Hello TRUE
## 6 1 Hello FALSE
## 7 3 Hello TRUE
## 8 5 Hello FALSE
## 9 7 Hello TRUE
## 10 9 Goodbye FALSE
A tibble is simply a data frame that prints with sanity. Notice in the output
above that we are given additional information such as dimension and variable
type.
The as_tibble() function can be used to coerce a regular data frame to a
tibble.