
Page 47 - Applied Statistics with R
P. 47
3.2. DATA STRUCTURES 47
head(mpg, n = 10)
## # A tibble: 10 x 11
## manufacturer model displ year cyl trans drv cty hwy fl class
## <chr> <chr> <dbl> <int> <int> <chr> <chr> <int> <int> <chr> <chr>
## 1 audi a4 1.8 1999 4 auto(l~ f 18 29 p comp~
## 2 audi a4 1.8 1999 4 manual~ f 21 29 p comp~
## 3 audi a4 2 2008 4 manual~ f 20 31 p comp~
## 4 audi a4 2 2008 4 auto(a~ f 21 30 p comp~
## 5 audi a4 2.8 1999 6 auto(l~ f 16 26 p comp~
## 6 audi a4 2.8 1999 6 manual~ f 18 26 p comp~
## 7 audi a4 3.1 2008 6 auto(a~ f 18 27 p comp~
## 8 audi a4 quat~ 1.8 1999 4 manual~ 4 18 26 p comp~
## 9 audi a4 quat~ 1.8 1999 4 auto(l~ 4 16 25 p comp~
## 10 audi a4 quat~ 2 2008 4 manual~ 4 20 28 p comp~
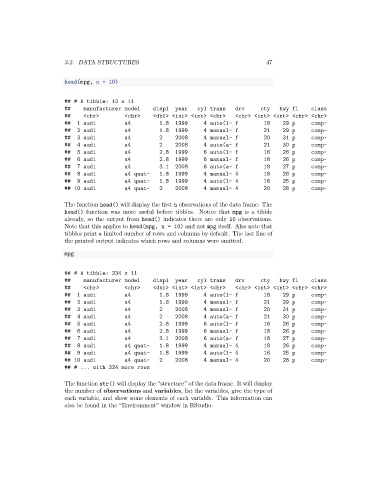
The function head() will display the first n observations of the data frame. The
head() function was more useful before tibbles. Notice that mpg is a tibble
already, so the output from head() indicates there are only 10 observations.
Note that this applies to head(mpg, n = 10) and not mpg itself. Also note that
tibbles print a limited number of rows and columns by default. The last line of
the printed output indicates which rows and columns were omitted.
mpg
## # A tibble: 234 x 11
## manufacturer model displ year cyl trans drv cty hwy fl class
## <chr> <chr> <dbl> <int> <int> <chr> <chr> <int> <int> <chr> <chr>
## 1 audi a4 1.8 1999 4 auto(l~ f 18 29 p comp~
## 2 audi a4 1.8 1999 4 manual~ f 21 29 p comp~
## 3 audi a4 2 2008 4 manual~ f 20 31 p comp~
## 4 audi a4 2 2008 4 auto(a~ f 21 30 p comp~
## 5 audi a4 2.8 1999 6 auto(l~ f 16 26 p comp~
## 6 audi a4 2.8 1999 6 manual~ f 18 26 p comp~
## 7 audi a4 3.1 2008 6 auto(a~ f 18 27 p comp~
## 8 audi a4 quat~ 1.8 1999 4 manual~ 4 18 26 p comp~
## 9 audi a4 quat~ 1.8 1999 4 auto(l~ 4 16 25 p comp~
## 10 audi a4 quat~ 2 2008 4 manual~ 4 20 28 p comp~
## # ... with 224 more rows
The function str() will display the “structure” of the data frame. It will display
the number of observations and variables, list the variables, give the type of
each variable, and show some elements of each variable. This information can
also be found in the “Environment” window in RStudio.