
Page 48 - Applied Statistics with R
P. 48
48 CHAPTER 3. DATA AND PROGRAMMING
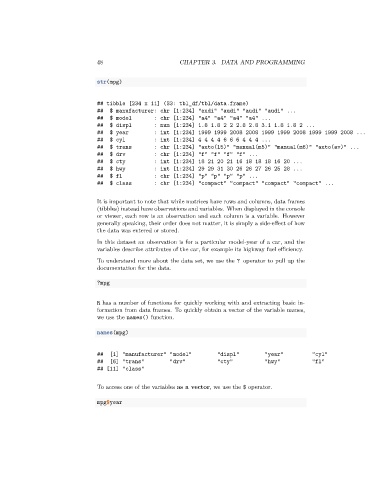
str(mpg)
## tibble [234 x 11] (S3: tbl_df/tbl/data.frame)
## $ manufacturer: chr [1:234] "audi" "audi" "audi" "audi" ...
## $ model : chr [1:234] "a4" "a4" "a4" "a4" ...
## $ displ : num [1:234] 1.8 1.8 2 2 2.8 2.8 3.1 1.8 1.8 2 ...
## $ year : int [1:234] 1999 1999 2008 2008 1999 1999 2008 1999 1999 2008 ...
## $ cyl : int [1:234] 4 4 4 4 6 6 6 4 4 4 ...
## $ trans : chr [1:234] "auto(l5)" "manual(m5)" "manual(m6)" "auto(av)" ...
## $ drv : chr [1:234] "f" "f" "f" "f" ...
## $ cty : int [1:234] 18 21 20 21 16 18 18 18 16 20 ...
## $ hwy : int [1:234] 29 29 31 30 26 26 27 26 25 28 ...
## $ fl : chr [1:234] "p" "p" "p" "p" ...
## $ class : chr [1:234] "compact" "compact" "compact" "compact" ...
It is important to note that while matrices have rows and columns, data frames
(tibbles) instead have observations and variables. When displayed in the console
or viewer, each row is an observation and each column is a variable. However
generally speaking, their order does not matter, it is simply a side-effect of how
the data was entered or stored.
In this dataset an observation is for a particular model-year of a car, and the
variables describe attributes of the car, for example its highway fuel efficiency.
To understand more about the data set, we use the ? operator to pull up the
documentation for the data.
?mpg
R has a number of functions for quickly working with and extracting basic in-
formation from data frames. To quickly obtain a vector of the variable names,
we use the names() function.
names(mpg)
## [1] "manufacturer" "model" "displ" "year" "cyl"
## [6] "trans" "drv" "cty" "hwy" "fl"
## [11] "class"
To access one of the variables as a vector, we use the $ operator.
mpg$year