Page 57 - Applied Statistics with R
P. 57

Chapter 4


                      Summarizing Data


                      4.1 Summary Statistics


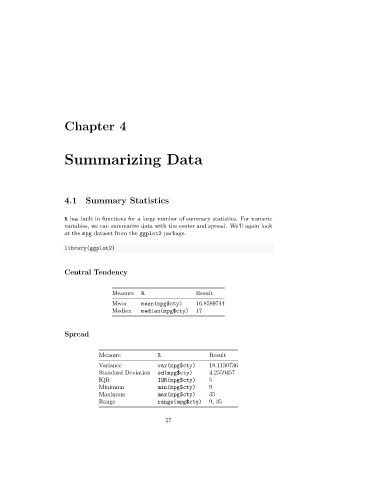
                      R has built in functions for a large number of summary statistics. For numeric
                      variables, we can summarize data with the center and spread. We’ll again look
                      at the mpg dataset from the ggplot2 package.
                      library(ggplot2)


                      Central Tendency


                                      Measure   R                 Result
                                      Mean      mean(mpg$cty)     16.8589744
                                      Median    median(mpg$cty)   17


                      Spread


                                  Measure            R                Result
                                  Variance           var(mpg$cty)     18.1130736
                                  Standard Deviation  sd(mpg$cty)     4.2559457
                                  IQR                IQR(mpg$cty)     5
                                  Minimum            min(mpg$cty)     9
                                  Maximum            max(mpg$cty)     35
                                  Range              range(mpg$cty)   9, 35


                                                        57
   52   53   54   55   56   57   58   59   60   61   62