Page 60 - Applied Statistics with R
P. 60

60                                CHAPTER 4. SUMMARIZING DATA


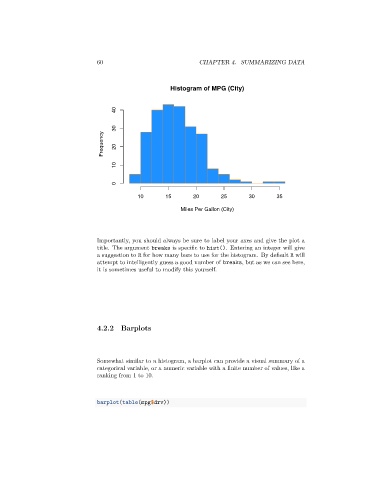
                                                         Histogram of MPG (City)


                                       40


                                       30
                                   Frequency  20


                                       10


                                       0
                                               10       15       20       25       30        35

                                                             Miles Per Gallon (City)


                                 Importantly, you should always be sure to label your axes and give the plot a
                                 title. The argument breaks is specific to hist(). Entering an integer will give
                                 a suggestion to R for how many bars to use for the histogram. By default R will
                                 attempt to intelligently guess a good number of breaks, but as we can see here,
                                 it is sometimes useful to modify this yourself.


                                 4.2.2   Barplots


                                 Somewhat similar to a histogram, a barplot can provide a visual summary of a
                                 categorical variable, or a numeric variable with a finite number of values, like a
                                 ranking from 1 to 10.


                                 barplot(table(mpg$drv))
   55   56   57   58   59   60   61   62   63   64   65