Page 59 - Applied Statistics with R
P. 59

4.2. PLOTTING                                                      59


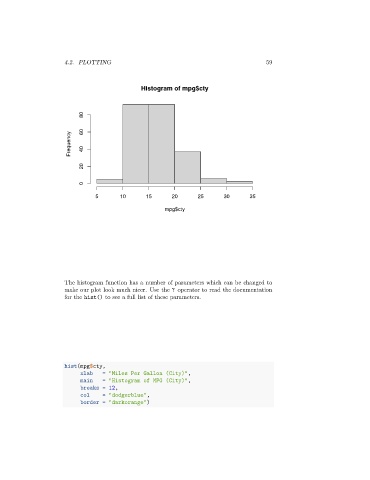
                                                Histogram of mpg$cty


                             80


                        Frequency  60  40


                             20


                             0
                                 5       10      15       20      25       30       35

                                                        mpg$cty


                      The histogram function has a number of parameters which can be changed to
                      make our plot look much nicer. Use the ? operator to read the documentation
                      for the hist() to see a full list of these parameters.


                      hist(mpg$cty,
                            xlab   = "Miles Per Gallon (City)",
                            main   = "Histogram of MPG (City)",
                            breaks = 12,
                            col    = "dodgerblue",
                            border = "darkorange")
   54   55   56   57   58   59   60   61   62   63   64