Page 62 - Applied Statistics with R
P. 62

62                                CHAPTER 4. SUMMARIZING DATA
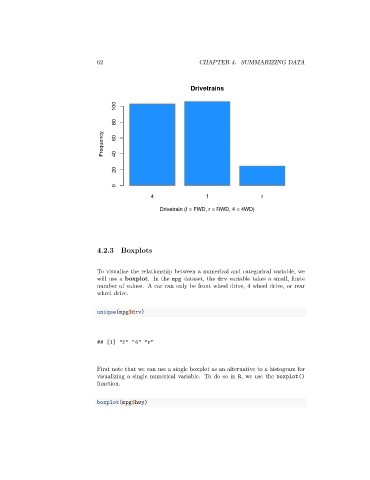


                                                                Drivetrains

                                       100


                                       80
                                   Frequency  60  40


                                       20


                                       0
                                                   4                 f                  r

                                                      Drivetrain (f = FWD, r = RWD, 4 = 4WD)


                                 4.2.3   Boxplots


                                 To visualize the relationship between a numerical and categorical variable, we
                                 will use a boxplot. In the mpg dataset, the drv variable takes a small, finite
                                 number of values. A car can only be front wheel drive, 4 wheel drive, or rear
                                 wheel drive.


                                 unique(mpg$drv)


                                 ## [1] "f" "4" "r"


                                 First note that we can use a single boxplot as an alternative to a histogram for
                                 visualizing a single numerical variable. To do so in R, we use the boxplot()
                                 function.


                                 boxplot(mpg$hwy)
   57   58   59   60   61   62   63   64   65   66   67