
Page 180 - Template Tesis UTM v2.0
P. 180
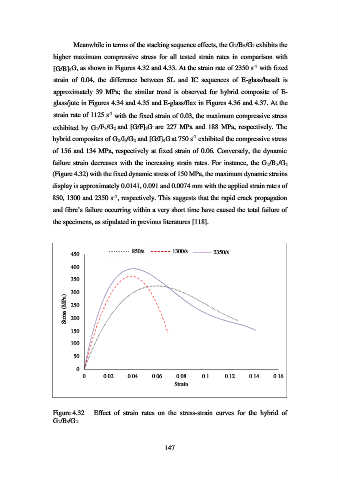
Meanwhile in terms of the stacking sequence effects, the G2/B3/G2 exhibits the

                   higher  maximum  compressive  stress  for  all  tested  strain  rates  in  comparison  with
                                                                                          -1
                   [G/B]3G, as shown in Figures 4.32 and 4.33. At the strain rate of 2350 s  with fixed
                   strain  of  0.04,  the  difference  between  SL  and  IC  sequences  of  E-glass/basalt  is
                   approximately  39  MPa;  the  similar  trend  is  observed  for  hybrid  composite  of  E-

                   glass/jute in Figures 4.34 and 4.35 and E-glass/flax in Figures 4.36 and 4.37. At the
                                       -1
                   strain rate of 1125 s  with the fixed strain of 0.03, the maximum compressive stress
                   exhibited  by  G2/F3/G2  and  [G/F]3G  are  227  MPa  and  188  MPa,  respectively.  The

                                                                     -1
                   hybrid composites of G2/J3/G2 and [G/J]3G at 750 s  exhibited the compressive stress
                   of 156 and 134 MPa, respectively at fixed strain of 0.06. Conversely, the dynamic

                   failure strain decreases  with the increasing strain rates. For instance, the G2/B3/G2
                   (Figure 4.32) with the fixed dynamic stress of 150 MPa, the maximum dynamic strains

                   display is approximately 0.0141, 0.091 and 0.0074 mm with the applied strain rates of
                                         -1
                   850, 1300 and 2350 s , respectively. This suggests that the rapid crack propagation
                   and fibre’s failure occurring within a very short time have caused the total failure of

                   the specimens, as stipulated in previous literatures [118].


                                               850/s          1300/s        2350/s
                          450

                          400

                          350

                          300
                        Stress (MPa)  250


                          200

                          150

                          100

                           50
                            0
                              0      0.02     0.04    0.06     0.08     0.1     0.12    0.14     0.16
                                                              Strain


                   Figure 4.32    Effect  of  strain  rates  on  the  stress-strain  curves  for  the  hybrid  of
                   G2/B3/G2


                                                           147