
Page 35 - Spotlight A+ SPM Additional Mathematics Form 4 & 5
P. 35
Form
5 Additional Mathematics Chapter 5 Probability Distribution
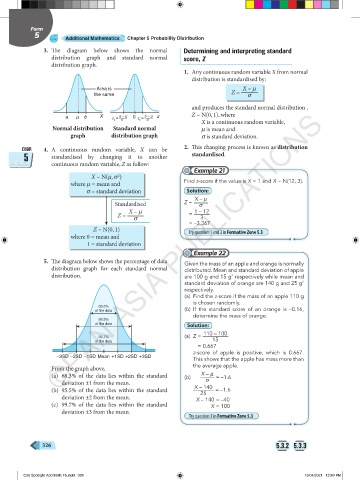
3. The diagram below shows the normal Determining and interpreting standard
distribution graph and standard normal score, Z
distribution graph.
1. Any continuous random variable X from normal
distribution is standardised by:
Area is Z = X – m
the same s
and produces the standard normal distribution ,
Z ~ N(0, 1), where
©PAN ASIA PUBLICATIONS
a – μ
b – μ
a μ b X z = –––– 0 z = –––– z
X is a continuous random variable,
a σ b σ
Normal distribution Standard normal m is mean and
graph distribution graph s is standard deviation.
CHAP. 4. A continuous random variable, X can be 2. This changing process is known as distribution
5 standardised by changing it to another standardised.
continuous random variable, Z as follow:
Example 21
X ~ N(m, s )
2
where m = mean and Find z-score if the value is X = 1 and X ~ N(12, 3).
s = standard deviation Solution:
X – m
Standardised Z = s
X – m 1 – 12
Z = s = 3
= –3.367
Z ~ N(0, 1) Try question 1 and 2 in Formative Zone 5.3
where 0 = mean and
1 = standard deviation
Example 22
5. The diagram below shows the percentage of data Given the mass of an apple and orange is normally
distribution graph for each standard normal distributed. Mean and standard deviation of apple
distribution. are 100 g and 15 g respectively while mean and
2
standard deviation of orange are 140 g and 25 g
2
respectively.
(a) Find the z-score if the mass of an apple 110 g
is chosen randomly.
68.3% (b) If the standard score of an orange is –0.16,
of the data
determine the mass of orange.
95.5%
Solution:
of the data
(a) Z = 110 – 100
99.7% 15
of the data
= 0.667
z-score of apple is positive, which is 0.667.
–3SD –2SD –1SD Mean +1SD +2SD +3SD
This shows that the apple has mass more than
From the graph above, the average apple.
(a) 68.3% of the data lies within the standard (b) X – m = –1.6
deviation ±1 from the mean. s
(b) 95.5% of the data lies within the standard X – 140 = –1.6
25
deviation ±2 from the mean. X – 140 = –40
(c) 99.7% of the data lies within the standard X = 100
deviation ±3 from the mean.
Try question 3 in Formative Zone 5.3
326 5.3.2 5.3.3
C05 Spotlight Add Math F5.indd 326 19/04/2021 12:43 PM