
Page 37 - Towards_a_New_Malaysia_The_2018_Election_and_Its_6146371_(z-lib.org)
P. 37
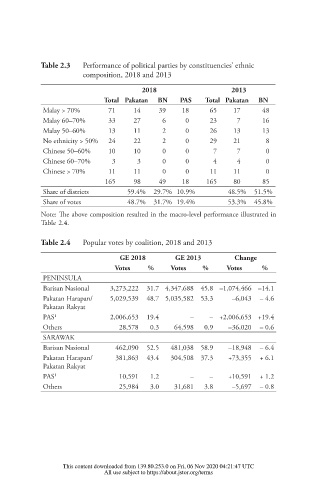
Table 2.3   Performance of political parties by constituencies’ ethnic
                              composition, 2018 and 2013
                                              2018                    2013
                                   Total Pakatan  BN    PAS    Total Pakatan  BN
                   Malay > 70%       71    14     39    18      65    17      48
                   Malay 60–70%      33    27       6     0     23      7     16
                   Malay 50–60%      13    11       2     0     26    13      13
                   No ethnicity > 50%   24  22      2     0     29    21       8
                   Chinese 50–60%    10    10       0     0      7      7      0
                   Chinese 60–70%     3      3      0     0      4      4      0
                   Chinese > 70%     11    11       0     0     11    11       0
                                    165    98     49    18     165    80      85
                   Share of districts     59.4%  29.7% 10.9%         48.5%  51.5%
                   Share of votes         48.7%  31.7% 19.4%         53.3%  45.8%
                  Note:  e above composition resulted in the macro-level performance illustrated in
                  Table 2.4.

                  Table 2.4   Popular votes by coalition, 2018 and 2013

                                        GE 2018        GE 2013         Change
                                      Votes    %     Votes    %     Votes     %
                   PENINSULA
                   Barisan Nasional  3,273,222  31.7 4,347,688 45.8 –1,074,466 –14.1
                   Pakatan Harapan/   5,029,539  48.7 5,035,582 53.3   –6,043  – 4.6
                   Pakatan Rakyat
                   PAS 1             2,006,653  19.4       –    – +2,006,653 +19.4
                   Others               28,578   0.3   64,598   0.9   –36,020  – 0.6
                   SARAWAK
                   Barisan Nasional    462,090  52.5   481,038 58.9   –18,948  – 6.4
                   Pakatan Harapan/    381,863  43.4   304,508 37.3   +73,355  + 6.1
                   Pakatan Rakyat
                   PAS 1                10,591   1.2       –    –    +10,591  + 1.2
                   Others               25,984   3.0   31,681   3.8   –5,697  – 0.8


                        This content downloaded from 139.80.253.0 on Fri, 06 Nov 2020 04:21:47 UTC
                                   All use subject to https://about.jstor.org/terms