
Page 40 - Towards_a_New_Malaysia_The_2018_Election_and_Its_6146371_(z-lib.org)
P. 40
How Malaysia Voted in 2018 25
was also very high in 2018, reaching 81 per cent, only marginally lower than
the 81.5 per cent recorded in 2013.
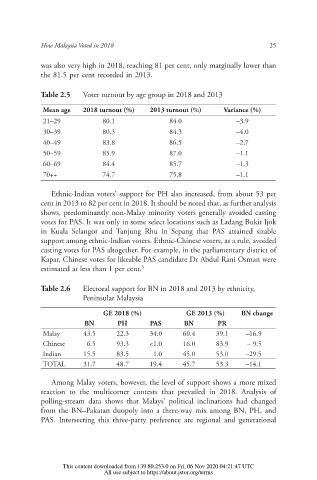
Table 2.5 Voter turnout by age group in 2018 and 2013
Mean age 2018 turnout (%) 2013 turnout (%) Variance (%)
21–29 80.1 84.0 –3.9
30–39 80.3 84.3 –4.0
40–49 83.8 86.5 –2.7
50–59 85.9 87.0 –1.1
60–69 84.4 85.7 –1.3
70++ 74.7 75.8 –1.1
Ethnic-Indian voters’ support for PH also increased, from about 53 per
cent in 2013 to 82 per cent in 2018. It should be noted that, as further analysis
shows, predominantly non-Malay minority voters generally avoided casting
votes for PAS. It was only in some select locations such as Ladang Bukit Ijok
in Kuala Selangor and Tanjung Rhu in Sepang that PAS attained sizable
support among ethnic-Indian voters. Ethnic-Chinese voters, as a rule, avoided
casting votes for PAS altogether. For example, in the parliamentary district of
Kapar, Chinese votes for likeable PAS candidate Dr Abdul Rani Osman were
estimated at less than 1 per cent. 5
Table 2.6 Electoral support for BN in 2018 and 2013 by ethnicity,
Peninsular Malaysia
GE 2018 (%) GE 2013 (%) BN change
BN PH PAS BN PR
Malay 43.5 22.3 34.0 60.4 39.1 –16.9
Chinese 6.5 93.3 <1.0 16.0 83.9 – 9.5
Indian 15.5 83.5 1.0 45.0 53.0 –29.5
TOTAL 31.7 48.7 19.4 45.7 53.3 –14.1
Among Malay voters, however, the level of support shows a more mixed
reaction to the multicorner contests that prevailed in 2018. Analysis of
polling-stream data shows that Malays’ political inclinations had changed
from the BN–Pakatan duopoly into a three-way mix among BN, PH, and
PAS. Intersecting this three-party preference are regional and generational
This content downloaded from 139.80.253.0 on Fri, 06 Nov 2020 04:21:47 UTC
All use subject to https://about.jstor.org/terms