
Page 404 - Math Smart - 7
P. 404
Using the pictogram, it is easier to pick out the least number of customers just by
o Spotlight looking at the length of each row being occupied by the icons. We do not need to
go through every single data value to interpret whether the next value is bigger
or smaller.
In the 21'* century,
computers are able to
present data in many m
different types of graphs
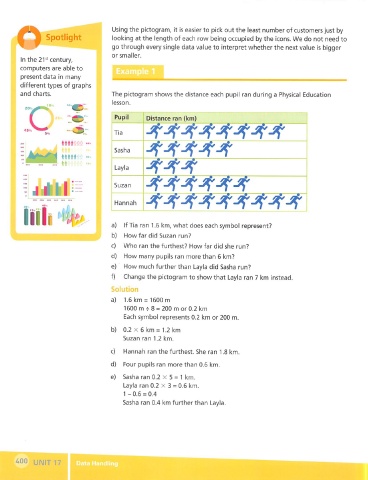
and charts. The pictogram shows the distance each pupil ran during a Physical Education
lesson.
- IQ
c Pupil Distance ran (km)
Tia
Sasha
Layla
Suzan
Ml
Hannah
a) If Tia ran 1.6 km, what does each symbol represent?
b) How far did Suzan run?
c) Who ran the furthest? How far did she run?
d) How many pupils ran more than 6 km?
e) How much further than Layla did Sasha run?
f) Change the pictogram to show that Layla ran 7 km instead.
Solution
a) 1.6 km = 1600 m
1600 m -r 8 = 200 m or 0.2 km
Each symbol represents 0.2 km or 200 m.
b) 0.2 X 6 km = 1.2 km
Suzan ran 1.2 km.
c) Hannah ran the furthest. She ran 1.8 km.
d) Four pupils ran more than 0.6 km.
e) Sasha ran 0.2 x 5 = 1 km.
Layla ran 0.2 x 3 = 0.6 km.
1-0.6 = 0.4
Sasha ran 0.4 km further than Layla.
400 UNIT 17