
Page 125 - Lecture Notes DCC3113
P. 125
Example 8.2
Contoh Soalan :
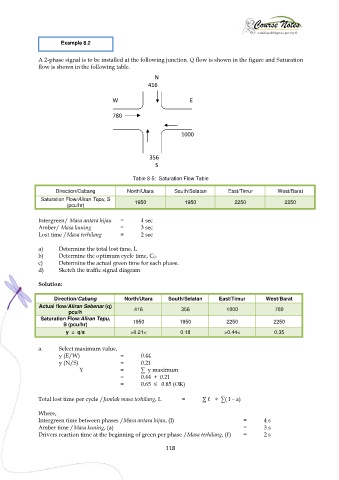
A 2-phase signal is to be installed at the following junction. Q flow is shown in the figure and Saturation
flow is shown in the following table.
N
416
W E
780
1000
356
S
Table 8-5: Saturation Flow Table
Direction/Cabang North/Utara South/Selatan East/Timur West/Barat
Saturation Flow/Aliran Tepu, S
(pcu/hr) 1950 1950 2250 2250
Intergreen/ Masa antara hijau = 4 sec
Amber/ Masa kuning = 3 sec
Lost time /Masa terhilang = 2 sec
a) Determine the total lost time, L
b) Determine the optimum cycle time, CO
c) Determine the actual green time for each phase.
d) Sketch the traffic signal diagram
Solution:
Direction/Cabang North/Utara South/Selatan East/Timur West/Barat
Actual flow/Aliran Sebenar (q) 416 356 1000 780
pcu/h
Saturation Flow/Aliran Tepu, 1950 1950 2250 2250
S (pcu/hr)
y = q/s >0.21< 0.18 >0.44< 0.35
a. Select maximum value,
y (E/W) = 0.44
y (N/S) = 0.21
Y = ∑ y maximum
= 0.44 + 0.21
= 0.65 ≤ 0.85 (OK)
Total lost time per cycle /Jumlah masa terhilang, L = ∑ ℓ + ∑( I – a)
Where,
Intergreen time between phases /Masa antara hijau, (I) = 4 s
Amber time /Masa kuning, (a) = 3 s
Drivers reaction time at the beginning of green per phase /Masa terhilang, (ℓ) = 2 s
118