
Page 121 - Lecture Notes DCC3113
P. 121
STEP 2 : Determination Of y Value
Where,
y = Ratio of flow to saturation flow
q = Actual flow on traffic-signal approach in pcu/hr (refer table 2 for conversion to pcu)
S = Saturation flow for the approach in pcu/hr
The Y value for a phase is the highest y value from the approaches within that phase. For the whole
junction , Y = Σyi
Where,
n = number of phases
yi = highest y value from the approach within phase I
The Y value is a measure for the occupancy of the intersection
Preferably, Y ≤ 0.85
If Y > 0.85, it is recommended that the geometrics of the intersection be upgraded to increase capacity
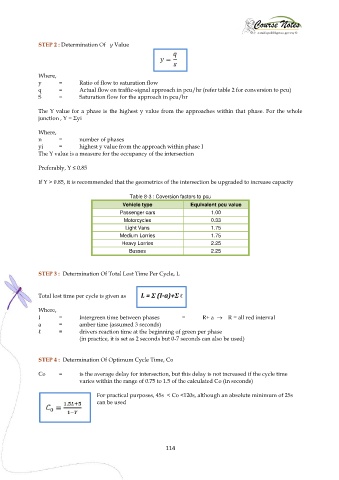
Table 8-3 : Coversion factors to pcu
Vehicle type Equivalent pcu value
Passenger cars 1.00
Motorcycles 0.33
Light Vans 1.75
Medium Lorries 1.75
Heavy Lorries 2.25
Busses 2.25
STEP 3 : Determination Of Total Lost Time Per Cycle, L
Total lost time per cycle is given as L = Σ (I-a)+Σ ℓ
Where,
I = Intergreen time between phases = R+ a R = all red interval
a = amber time (assumed 3 seconds)
ℓ = drivers reaction time at the beginning of green per phase
(in practice, it is set as 2 seconds but 0-7 seconds can also be used)
STEP 4 : Determination Of Optimum Cycle Time, Co
Co = is the average delay for intersection, but this delay is not increased if the cycle time
varies within the range of 0.75 to 1.5 of the calculated Co (in seconds)
For practical purposes, 45s < Co <120s, although an absolute minimum of 25s
can be used
114