
Page 122 - Lecture Notes DCC3113
P. 122
STEP 5 : Determination Of Signal Settings
Effective green time plus the change interval minus the lost for a designated phase.
The total effective green time = cycle time- total lost time
g1+g2+…+gn = Co - L
When n denotes the number of phases and gn is the effective green time for phase n.
For optimum conditions, (2 phase cycle) g1/g2 = yi
With the above ratio, the following formulas apply to each individual phase (in seconds)
Where,
gn = effective green time of the nth single phase
Yn = calculated Y-value of the same signal; phase
G = g + ℓ + R Where,
G = actual green time
K = Controller Setting time
K = G – a – R
= g + ℓ – a
Phase Diagram
Gn = gn + ℓ + R
Kn = Gn - a - R I
PHASE N GREEN a R RED GREEN
ℓ gn = yn (Co - L)/Y
Optimum Cycle, Co = (1.5L + 5)/(1 - Y)
Example 8.1
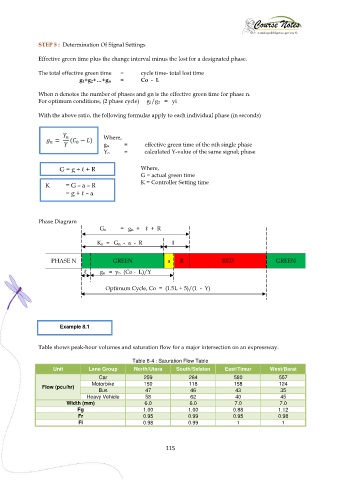
Table shows peak-hour volumes and saturation flow for a major intersection on an expressway.
Table 8-4 : Saturation Flow Table
Unit Lane Group North/Utara South/Selatan East/Timur West/Barat
Car 259 264 580 557
Motorbike 150 118 158 124
Flow (pcu/hr)
Bus 47 46 43 35
Heavy Vehicle 58 62 40 45
Width (mm) 6.0 6.0 7.0 7.0
Fg 1.00 1.00 0.88 1.12
Fr 0.95 0.99 0.95 0.98
Fl 0.98 0.99 1 1
115