
Page 123 - Lecture Notes DCC3113
P. 123
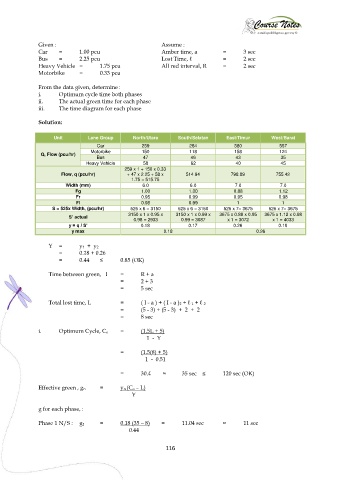
Given :                                    Assume :
               Car    =      1.00 pcu                     Amber time, a        =       3 sec
               Bus    =      2.25 pcu                     Lost Time, ℓ         =       2 sec
               Heavy Vehicle  =     1.75 pcu              All red interval, R   =      2 sec
               Motorbike     =      0.33 pcu

               From the data given, determine :
               i.     Optimum cycle time both phases
               ii.    The actual green time for each phase
               iii.    The time diagram for each phase

               Solution:

                    Unit        Lane Group      North/Utara     South/Selatan    East/Timur     West/Barat
                                   Car             259              264            580             557
                                 Motorbike         150              118            158             124
               Q, Flow (pcu/hr)
                                   Bus             47               46              43              35
                               Heavy Vehicle       58               62              40              45
                                             259 x 1 + 150 x 0.33
                       Flow, q (pcu/hr)       + 47 x 2.25 + 58 x   514.94         798.89          755.42
                                               1.75 = 515.75
                        Width (mm)                 6.0              6.0             7.0            7.0
                           Fg                      1.00            1.00            0.88            1.12
                            Fr                     0.95            0.99            0.95            0.98
                            Fl                     0.98            0.99             1               1
                   S = 525x Width, (pcu/hr)    525 x 6 = 3150    525 x 6 = 3150   525 x 7= 3675   525 x 7= 3675
                                              3150 x 1 x 0.95 x   3150 x 1 x 0.99 x   3675 x 0.88 x 0.95   3675 x 1.12 x 0.98
                         S’ actual
                                                0.98 = 2933      0.99 = 3087     x 1 = 3072      x 1 = 4033
                         y = q / S’               0.18             0.17            0.26            0.19
                          y max                            0.18                            0.26

                  Y   =      y1  +  y2
                          =    0.18 + 0.26
                       =     0.44    ≤     0.85 (OK)

                  Time between green,   I    =     R + a
                                                     =    2 + 3
                                                =    5 sec

                  Total lost time, L       =       ( I - a ) + ( I - a )2 + ℓ 1 + ℓ 2
                                                     =    (5 - 3) + (5 - 3)  +  2  +  2
                                             =     8 sec

               i.     Optimum Cycle, Co    =       (1.5L + 5)
                                                                          1  -  Y

                                                           =    (1.5(8) + 5)
                                                                         1  -  0.51

                                               =    30.4    ≈    35 sec   ≤    120 sec (OK)

               Effective green , gn    =    yn (Co – L)
                                                                  Y

               g for each phase, :

               Phase 1 N/S :  g1    =      0.18 (35 – 8)        =    11.04 sec    ≈    11 sec
                                                       0.44


                                                           116