
Page 364 - fbkCardioDiabetes_2017
P. 364
Evaluvation of Cardiac Syncope And ECG Markers of
340
Sudden Cardiac Arrest.
ly in standing positions or after change of posture
suggest vasovagal etiology. Similarly situations like
micturition cough/exercise triggering syncope sug-
gest vasovagal etiology. Palpitations preceding syn-
cope or syncope post exercise termination suggest
an arrhythmic cause. Syncope in lying down position
mostly suggests arrhythmic/cardiac cause.
High risk features in history are:
Syncope post exercise or in supine position.
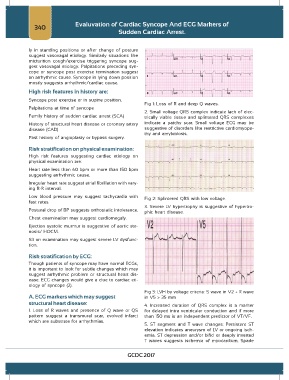
Fig 1: Loss of R and deep Q waves.
Palpitations at time of syncope
2. Small voltage QRS complex indicate lack of elec-
Family history of sudden cardiac arrest (SCA) trically viable tissue and splintered QRS complexes
History of structural heart disease or coronary artery indicate a patchy scar. Small voltage ECG may be
disease (CAD) suggestive of disorders like restrictive cardiomyopa-
thy and amyloidosis.
Past history of angioplasty or bypass surgery.
Risk stratification on physical examination:
High risk features suggesting cardiac etiology on
physical examination are:
Heart rate less than 60 bpm or more than 150 bpm
suggesting arrhythmic cause.
Irregular heart rate suggest atrial fibrillation with vary-
ing R-R interval.
Low blood pressure may suggest tachycardia with Fig 2: Splintered QRS with low voltage.
fast rates.
3. Severe LV hypertrophy is suggestive of hypertro-
Postural drop of BP suggests orthostatic intolerance. phic heart disease.
Chest examination may suggest cardiomegaly.
Ejection systolic murmur is suggestive of aortic ste-
nosis/ HOCM.
S3 on examination may suggest severe LV dysfunc-
tion.
Risk stratification by ECG:
Though patients of syncope may have normal ECGs,
it is important to look for subtle changes which may
suggest arrhythmic problem or structural heart dis-
ease. ECG changes would give a clue to cardiac eti-
ology of syncope (2).
Fig 3: LVH by voltage criteria: S wave in V2 + R wave
A. ECG markers which may suggest in V5 > 35 mm
structural heart disease: 4. Increased duration of QRS complex is a marker
1. Loss of R waves and presence of Q wave or QS for delayed intra ventricular conduction and if more
pattern suggest a transmural scar, evolved infarct than 150 ms is an independent predictor of VT/VF.
which are substrate for arrhythmias.
5. ST segment and T wave changes: Persistent ST
elevation indicates aneurysm of LV or ongoing isch-
emia. ST depression and/or bifid or deeply inverted
T waves suggests ischemia of myocardium. Spade
GCDC 2017