
Page 388 - fbkCardioDiabetes_2017
P. 388
364 Cardio Diabetes Medicine 2017
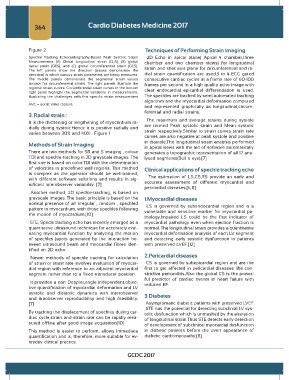
Figure 2 Techniques of Performing Strain Imaging
Speckle Tracking Echocardiography-Based Peak Systolic Strain 2D Echo in apical plane( Apical 4 chamber,three
Measurements (A) Global longitudinal strain (GLS), (B) global chamber and two chamber views) for longitudinal
radial strain (GRS), and (C) global circumferential strain (GCS). strain and shot axis plane for circumferential and ra-
The left panels show the direction (arrows demonstrate the
direction) in which various strain parameters are being measured. dial strain quantification are used.3 to 4 ECG gated
The middle panels demonstrate the segmental strain values consecutive cardiac cycles at a frame rate of 60-100
(except for circumferential strain). The right panels illustrate the frames per second in a high quality echo image with
regional strain curves. Circumferential strain curves in the bottom clear endocardial epicardial differentiation is used.
right panel highlight the segmental variability in measurements,
illustrating the challenges with this specific strain measurement The speckles are tracked by semi automated tracking
algorithm and the myocardial deformation computed
AVC = aortic valve closure.
and represented graphically as longitudinal,circum-
ferential and radial strains.
3. Radial strain :
It is the thickening or lengthening of myocardium ra- The maximum and average strains during systole
dially during systole.Hence it is positive radially and are termed Peak systolic strain and Mean systolic
varies between 30% and 40% . Figure 1 strain respectively.Similar to strain curves strain rate
curves are also negative at peak systole and positive
in diastole.The longitudinal strain analysis performed
Methods of Strain Imaging
in apical views with the aid of software automatically
There are two methods for SR and S imaging , colour generates a topograohic representation of all 17 ana-
TDI and speckle-tracking in 2D greyscale images. The lysed segments(Bull s eye).[7]
first one is based on color TDI with the determination
of velocities in predefined wall regions. This method Clinical applications of speckle tracking echo
is complex as the operator should be well-trained,
with different software solutions and results in sig- The estimation of LS,CS,RS provide an early and
nificant interobserver variability. [7] accurate assessment of different myocardial and
pericardial diseases.[4,11]
Another method, 2D speckle-tracking, is based on
greyscale images. The basic principle is based on the 1.Myocardial diseases
normal presence of an irregular , random , speckled LS is governed by subendocardial region and is a
pattern in myocardium, with those speckles following vulnerable and sensitive marker for myocardial pa-
the motion of myocardium.[10]
thology.Impaired LS could be the first indicator of
STE, Specle tracking echo has recently emerged as a myocardial pathology even when ejection fraction is
quantitative ultrasound technique for accurately eval- normal. The longitudinal strain provides a quantitative
uating myocardial function by analyzing the motion myocardial deformation analysis of each LV segment
of speckles (spots generated by the interaction be- and detecting early systolic dysfunction in patients
tween ultrasound beam and myocardial fibres iden- with preserved LVEF.[12]
tified on 2D echo.
2.Pericardial diseases
Newer methods of speckle tracking for calculation
of strain or strain rate involves evaluation of myocar- CS is governed by subepicardial region and are the
dial region with reference to an adjacent myocardial first to get affected in pericardial diseases like con-
segment rather than to a fixed transducer position. strictive pericarditis.Also the global CS is the power-
ful predictor of cardiac events in heart failure with
It provides a non Doppler,angle independent,objec- reduced EF.
tive quantification of myocardial deformation and LV
systolic and diastolic dynamics with interobserver
and itraobserver reproducibility and high feasibility. 3.Diabetes
[7] Asymptomatic diabetic patients with preserved LVEF
,STE has the potential for detecting subclinial LV sys-
By tracking the displacement of speckles during car- tolic dysfunction which is unmasked by the alteration
diac cycle,strain and strain rate can be rapidly mea- of longitudinal strain.Thus STE detects early detection
sured offline after good image acquisition[10]
of development of subclinical myocardial dysfunction
This method is easier to perform, allows immediate in diabetic patients before the overt appearance of
quantification and is, therefore, more suitable for ev- diabetic cardiomyopathy.[8]
eryday clinical practice.
GCDC 2017