Page 108 - 2018 Comprehensive Annual Financial Report - City of Winston-Salem
P. 108

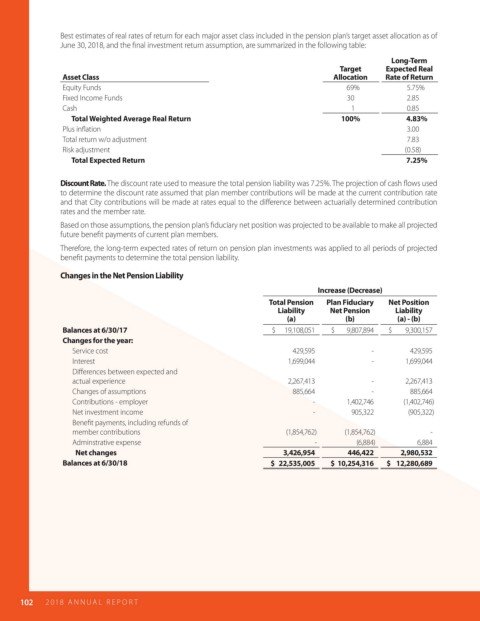
Best estimates of real rates of return for each major asset class included in the pension plan’s target asset allocation as of
                      June 30, 2018, and the  nal investment return assumption, are summarized in the following table:
                                                                                                           Long-Term
                                                                                             Target      Expected Real
                       Asset Class                                                          Allocation   Rate of Return
                       Equity Funds                                                              69%           5.75%
                       Fixed Income Funds                                                      30              2.85
                       Cash                                                                       1            0.85
                             Total Weighted Average Real Return                               100%            4.83%
                       Plus in ation                                                                           3.00
                       Total return w/o adjustment                                                             7.83
                       Risk adjustment                                                                        (0.58)
                             Total Expected Return                                                            7.25%


                      Discount Rate. The discount rate used to measure the total pension liability was 7.25%. The projection of cash  ows used
                      to determine the discount rate assumed that plan member contributions will be made at the current contribution rate
                      and that City contributions will be made at rates equal to the di erence between actuarially determined contribution
                      rates and the member rate.

                      Based on those assumptions, the pension plan’s  duciary net position was projected to be available to make all projected
                      future bene t payments of current plan members.
                      Therefore, the long-term expected rates of return on pension plan investments was applied to all periods of projected
                      bene t payments to determine the total pension liability.

                      Changes in the Net Pension Liability
                                                                                        Increase (Decrease)
                                                                           Total Pension   Plan Fiduciary   Net Position
                                                                              Liability    Net Pension      Liability
                                                                                (a)            (b)          (a) - (b)
                       Balances at 6/30/17                                  $      19,108,051  $        9,807,894  $         9,300,157
                       Changes for the year:
                             Service cost                                        429,595              -        429,595
                             Interest                                           1,699,044             -       1,699,044
                             Di erences between expected and
                             actual experience                                  2,267,413             -       2,267,413
                             Changes of assumptions                              885,664              -        885,664
                             Contributions - employer                                  -       1,402,746      (1,402,746)
                             Net investment income                                     -        905,322        (905,322)
                             Bene t payments, including refunds of
                             member contributions                               (1,854,762)    (1,854,762)           -
                             Adminstrative expense                                     -          (6,884)        6,884
                                Net changes                                    3,426,954       446,422       2,980,532
                       Balances at 6/30/18                                  $   22,535,005  $  10,254,316  $    12,280,689


            102   2018  AN NUAL  R E P O R T
   103   104   105   106   107   108   109   110   111   112   113