
Page 119 - Physics Form 5 KSSM_Neat
P. 119
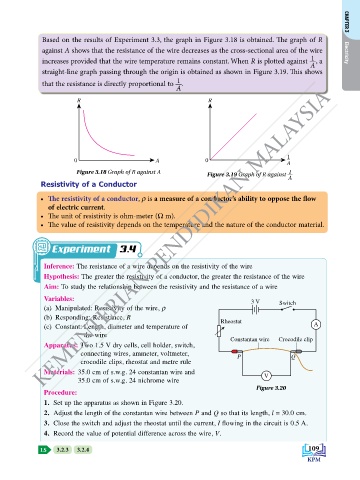
Based on the results of Experiment 3.3, the graph in Figure 3.18 is obtained. The graph of R   CHAPTER 3
              against A shows that the resistance of the wire decreases as the cross-sectional area of the wire   Electricity
                                                                                              1
              increases provided that the wire temperature remains constant. When R is plotted against  , a
                                                                                              A
              straight-line graph passing through the origin is obtained as shown in Figure 3.19. This shows
                                                      1
              that the resistance is directly proportional to  .
                                                      A
              KEMENTERIAN PENDIDIKAN MALAYSIA
                        R                                       R


                                                                                       1
                       0                        A              0                       –
                                                                                       A
                        Figure 3.18 Graph of R against A       Figure 3.19 Graph of R against
                                                                                        1
              Resistivity of a Conductor                                               A
             •  The resistivity of a conductor, r is a measure of a conductor’s ability to oppose the flow
               of electric current.
             •  The unit of resistivity is ohm-meter (W m).
             •  The value of resistivity depends on the temperature and the nature of the conductor material.


                  x              t 3.4

              Inference: The resistance of a wire depends on the resistivity of the wire
              Hypothesis: The greater the resistivity of a conductor, the greater the resistance of the wire
              Aim: To study the relationship between the resistivity and the resistance of a wire
              Variables:                                                    3 V
              (a)  Manipulated: Resistivity of the wire, r                           Switch
              (b)  Responding: Resistance, R
                                                                   Rheostat
              (c)  Constant: Length, diameter and temperature of                               A
                          the wire
                                                                      Constantan wire  Crocodile clip
              Apparatus: Two 1.5 V dry cells, cell holder, switch,
                         connecting wires, ammeter, voltmeter,          P               Q
                         crocodile clips, rheostat and metre rule
              Materials:  35.0 cm of s.w.g. 24 constantan wire and
                                                                                V
                        35.0 cm of s.w.g. 24 nichrome wire
                                                                              Figure 3.20
              Procedure:
              1.  Set up the apparatus as shown in Figure 3.20.
              2.  Adjust the length of the constantan wire between P and Q so that its length, l = 30.0 cm.
              3.  Close the switch and adjust the rheostat until the current, I flowing in the circuit is 0.5 A.
              4.  Record the value of potential difference across the wire, V.

             LS     3.2.3     3.2.4                                                           109