
Page 117 - Physics Form 5 KSSM_Neat
P. 117
Results: CHAPTER 3
Table 3.6
Length of wire, l / cm Current , I / A Potential difference, V / V Resistance, R / Ω Electricity
20.0
40.0
KEMENTERIAN PENDIDIKAN MALAYSIA
60.0
80.0
100.0
Data analysis:
Plot a graph of resistance, R against the length of wire, l.
Conclusion:
What conclusion can be drawn from this experiment?
Prepare a complete report of this experiment.
Discussion:
State one precaution that needs to be taken to ensure that the wire temperature is constant
throughout the experiment.
x t 3.3
Inference: The resistance of a wire depends on the cross-sectional area of the wire
Hypothesis: The larger the cross-sectional area of the wire, the smaller the resistance of the wire
Aim: To study the relationship between the cross-sectional area and the resistance of a wire
Variables:
(a) Manipulated: Cross-sectional area of wire, A
(b) Responding: Resistance, R
(c) Constant: Length, resistivity and temperature of the wire
Apparatus: Two 1.5 V dry cells, cell holder, switch, ammeter, voltmeter, connecting wires,
crocodile clips, rheostat and metre rule
Materials: 30.0 cm constantan wires of s.w.g. 22, s.w.g. 24, s.w.g. 26, s.w.g. 28 and s.w.g. 30
Procedure:
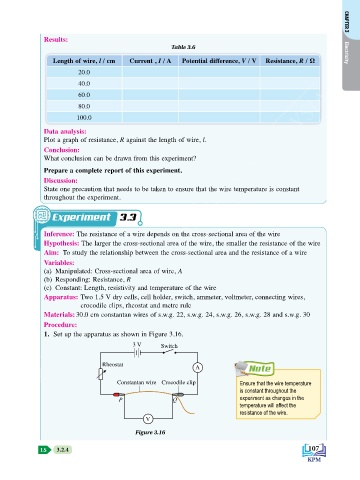
1. Set up the apparatus as shown in Figure 3.16.
3 V Switch
Rheostat
A Note
Constantan wire Crocodile clip Ensure that the wire temperature
is constant throughout the
experiment as changes in the
P Q
temperature will affect the
resistance of the wire.
V
Figure 3.16
3.2.4
LS 3.2.4 107