
Page 118 - Physics Form 5 KSSM_Neat
P. 118
2. Connect a 25 cm length of s.w.g. 22 constantan wire between P and Q.
3. Close the switch and adjust the rheostat until the current, I flowing in the circuit is 0.5 A.
4. Record the value of the potential difference across the wire.
5. Repeat steps 2 to 4 using the s.w.g. 24, s.w.g. 26, s.w.g. 28 and s.w.g. 30 constantan wires.
6. Based on the diameters given in Table 3.7, calculate the cross-sectional area of wire, A = pr
2
V
KEMENTERIAN PENDIDIKAN MALAYSIA
and resistance, R = for the five sets of data obtained (r = wire radius).
I
7. Record all the values for cross-sectional area, A, current, I, potential difference, V and
resistance, R in Table 3.7.
Results:
Table 3.7
Diameter, Cross-sectional Current, Potential Resistance,
s.w.g.
d / mm area, A / mm 2 I / A difference, V / V R / Ω
22 0.711
24 0.559
26 0.457
28 0.376
30 0.315
Data analysis:
Plot a graph of resistance, R against cross-sectional area of wire, A.
Conclusion:
What conclusion can be drawn from this experiment?
Prepare a complete report of this experiment.
Discussion:
State the relationship between:
(a) the cross-sectional area and the resistance of a wire.
(b) the value of s.w.g. and the resistance of a wire.
R
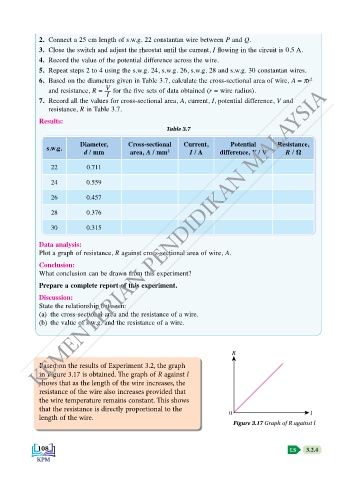
Based on the results of Experiment 3.2, the graph
in Figure 3.17 is obtained. The graph of R against l
shows that as the length of the wire increases, the
resistance of the wire also increases provided that
the wire temperature remains constant. This shows
that the resistance is directly proportional to the
length of the wire. 0 l
Figure 3.17 Graph of R against l
108 LS 3.2.4