
Page 144 - Color_Atlas_of_Physiology_5th_Ed._-_A._Despopoulos_2003
P. 144
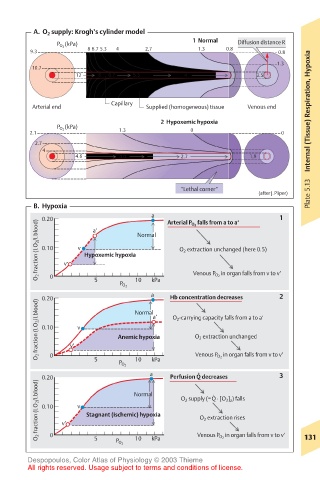
A.  O 2  supply: Krogh’s cylinder model
                                            1  Normal
                (kPa)                                 Diffusion distance R
              P O 2
        9.3          8 6.7  5.3  4  2,7       1.3   0.8         0.8
                                                               1.3
        10.7
                  12   8  6.7  5.3         4               3.5

                          Capillary
        Arterial end              Supplied (homogeneous) tissue  Venous end  Internal (Tissue) Respiration, Hypoxia
                                     2  Hypoxemic hypoxia
                (kPa)
              P O 2         1.3             0
        2.1                                                     0
         2.7
           4
                  4.6       4.0           2.7            1,9

                                          “Lethal corner”
                                                           (after J.Piiper)  Plate 5.13
         B.  Hypoxia
                                   a
          0.20        a‘               Arterial P O 2  falls from a to a‘  1
         O 2  fraction (LO 2 /Lblood)  0.10  v‘  v  Hypoxemic hypoxia  Normal  O 2  extraction unchanged (here 0.5)


            0
                      5
                            P O 2  10  kPa  Venous P O 2  in organ falls from v to v‘
                                   a
          0.20                 Normal  Hb concentration decreases  2
         O 2  fraction (LO 2 /Lblood)  0.10  v‘  v  Anemic hypoxia  O 2 -carrying capacity falls from a to a‘
                                   a‘

                                             O 2  extraction unchanged
            0
                      5
                            P O 2  10  kPa   Venous P O 2  in organ falls from v to v‘
                                   a                           ·
          0.20                         Perfusion Q decreases    3
         O 2  fraction (LO 2 /Lblood)  0.10  v‘  v  Stagnant (ischemic) hypoxia                             ·
                               Normal
                                          O 2  supply (=Q · [O 2 ] a ) falls
                                              O 2  extraction rises
            0
                      5
                           P O 2  10  kPa    Venous P O 2  in organ falls from v to v‘  131
       Despopoulos, Color Atlas of Physiology © 2003 Thieme
       All rights reserved. Usage subject to terms and conditions of license.