
Page 142 - Color_Atlas_of_Physiology_5th_Ed._-_A._Despopoulos_2003
P. 142
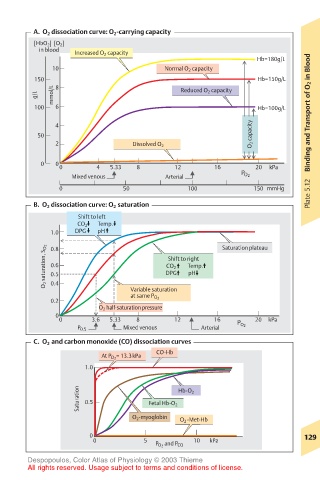
A.  O 2  dissociation curve: O 2 -carrying capacity
         [HbO 2 ]  [O 2 ]
          in blood  Increased O 2  capacity
                                                           Hb=180g/L
             10                       Normal O 2  capacity
         150  8                                            Hb=150g/L
         g/L  mmol/L                      Reduced O 2  capacity
         100  6                                            Hb=100g/L   Binding and Transport of O 2 in Blood

              4
         50                                               O 2  capacity
              2                Dissolved O 2
          0   0
              0        4  5.33  8       12       16        20  kPa
                 Mixed venous         Arterial         P O 2
                                                                       Plate 5.12
              0              50            100            150 mmHg
         B.  O 2  dissociation curve: O 2  saturation
                      Shift to left
                          CO 2          Temp.
            1.0    DPG          pH                 Saturation plateau
           O 2  saturation, S O 2  0.6         CO 2           Temp.
            0.8
                                           Shift to right
                                      DPG          pH
            0.5
            0.4
                              Variable saturation
                              at same P O 2
            0.2
                       O 2  half-saturation pressure
              0
              0       3.6  5.33  8      12       16   P O2  20  kPa
                  P 0.5      Mixed venous     Arterial
         C.  O 2  and carbon monoxide (CO) dissociation curves
                                    CO-Hb
                        At P O 2 = 13.3kPa
                    1.0

                   Saturation  0.5  Fetal Hb-O 2  Hb-O 2


                               O 2 -myoglobin  O 2  -Met-Hb

                     0                                               129
                      0          5           10  kPa
                                    P O 2  and P CO
       Despopoulos, Color Atlas of Physiology © 2003 Thieme
       All rights reserved. Usage subject to terms and conditions of license.