
Page 395 - Color_Atlas_of_Physiology_5th_Ed._-_A._Despopoulos_2003
P. 395
2
ln y
ln y 3
y=a·e b·x
lny=lna + b·x
y=a·x b
lny=lna + b·lnx
Exponential function
Appendix x (linear) Power function
13 1 ln x
y (linear) 4
y (linear)
Linear function y=a + b·lnx
Logarithmic function
x (linear)
ln x
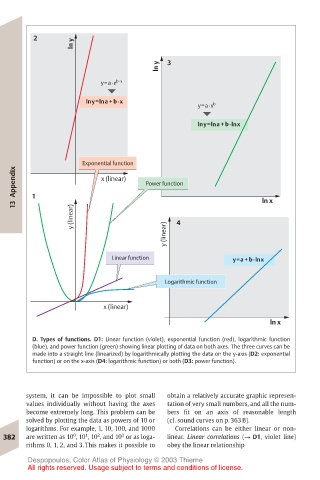
D. Types of functions. D1: Linear function (violet), exponential function (red), logarithmic function
(blue), and power function (green) showing linear plotting of data on both axes. The three curves can be
made into a straight line (linearized) by logarithmically plotting the data on the y-axis (D2: exponential
function) or on the x-axis (D4: logarithmic function) or both (D3: power function).
system, it can be impossible to plot small obtain a relatively accurate graphic represen-
values individually without having the axes tation of very small numbers, and all the num-
become extremely long. This problem can be bers fit on an axis of reasonable length
solved by plotting the data as powers of 10 or (cf. sound curves on p. 363 B).
logarithms. For example, 1, 10, 100, and 1000 Correlations can be either linear or non-
0
2
1
3
382 are written as 10 , 10 , 10 , and 10 or as loga- linear. Linear correlations (! D1, violet line)
rithms 0, 1, 2, and 3. This makes it possible to obey the linear relationship
Despopoulos, Color Atlas of Physiology © 2003 Thieme
All rights reserved. Usage subject to terms and conditions of license.