
Page 128 - Hall et al (2015) Principles of Critical Care-McGraw-Hill
P. 128
94 PART 1: An Overview of the Approach to and Organization of Critical Care
create a pernicious bias. For example, hospitals providing care to more assignment of appropriate diagnosis is very important in making an accu-
severely ill patients will tend to have actual mortality rates above pre- rate mortality prediction. The principal diagnosis could differ between
15
dicted, and thus will appear to be giving poor care. On the other hand, prospective identification versus retrospective chart review. 54
hospitals with less severely ill patients will tend to have actual mortality
rates lower than predicted, and will appear to be giving better than aver- ■ SEVERITY-OF-ILLNESS SCORING SYSTEMS
age care. 80 FOR SPECIFIC DISEASE CATEGORIES
■ LEAD-TIME BIAS For patients with specific disease processes, it is debated whether
specific severity scoring systems are better than general ones. Because
Lead-time bias refers to the different lengths of time that patients are inaccuracy of diagnosis can cause error, we recommend that scoring sys-
ill prior to ICU care and scoring. Lead-time differences also influence tems be tested for different diagnostic categories. Both disease-specific
treatment decisions, as well as predicted and actual mortality. Acute systems (APACHE II and APACHE III) and non–disease-specific sys-
physiology scores do not assess previous treatments. Thus, for the same tems (SAPS II and MPM II) need to be compared in external validating
score, a patient hypoxemic in the emergency room can improve rapidly patient samples. 15
and have a better outcome than a patient referred from another hospital APACHE II, APACHE III, and SAPS II have performed well in several
for persistent hypoxemia. Because of lead-time bias, APACHE II under- disease-specific categories, including liver failure, 81,82 malignancy, 83-85
estimates the mortality of patients referred from other ICUs, other cardiac bypass surgery, 86-88 sepsis, peritonitis, 90-92 pancreatitis, 93-99 acute
89
25
hospitals, or even within other parts of the same hospital. APACHE III myocardial infarction, 100-103 HIV patients, 104,105 obstetric patients, and
15
106
contains a variable to assess patient location and treatment prior to ICU stroke. APACHE III performed well in head-injured patients. 108,109 In
107
admission in an attempt to minimize lead-time bias. general, the performance of APACHE II, APACHE III, and SAPS II for
Therapies provided prior to and immediately after ICU admission these disease processes was similar to that reported for heterogeneous
change physiologic variables and thus influence physiologic scores. ICU patients.
Rapid and successful resuscitation in the emergency department prior APACHE II and III have consistently performed poorly in
to ICU admission or early in the ICU will hide abnormally low values trauma, 46,110,111 in postoperative patients, 112,113 and in women with
of variables that would have been recorded as the worst over 24 hours. eclampsia. 114
Theoretically, poor care would increase physiologic scores and increase
predicted mortality rate, whereas good care would decrease scores and ■ INACCURACY OF SCORING SYSTEMS FOR CERTAIN TYPES OF
reduce predicted mortality rate. The effects of treatment can be mini- INTENSIVE CARE UNITS OR DIFFERENT GEOGRAPHIC REGIONS
80
mized and mortality prediction might be enhanced by using hospital
presentation data. The patient cohorts used to derive and validate a scoring system can
influence the mortality predictions. There are potentially important
■ IMPRECISE PRINCIPAL DIAGNOSIS differences in outcomes of comparable patients in community versus
teaching hospitals, in different regions of a country, and in different
Inaccurate diagnosis is another source of error in many scoring systems. countries because of the influence of health care funding and policy. For
Some scoring systems (eg, APACHE III) predict different prognoses of example, a comparison of New Zealand and US hospitals demonstrated
patients who have different diseases but similar physiologic abnormalities. different patient selection and fewer ICU admissions in New Zealand,
Accurate diagnosis can be difficult in the critically ill for several reasons. and yet found similar hospital mortality. 55
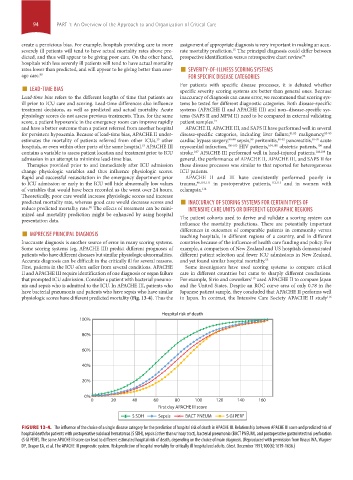
First, patients in the ICU often suffer from several conditions. APACHE Some investigators have used scoring systems to compare critical
II and APACHE III require identification of one diagnosis or organ failure care in different countries but came to sharply different conclusions.
that prompted ICU admission. Consider a patient with bacterial pneumo- For example, Sirio and coworkers used APACHE II to compare Japan
115
nia and sepsis who is admitted to the ICU. In APACHE III, patients who and the United States. Despite an ROC curve area of only 0.78 in the
have bacterial pneumonia and patients who have sepsis who have similar Japanese patient sample, they concluded that APACHE II performs well
physiologic scores have different predicted mortality (Fig. 13-4). Thus the in Japan. In contrast, the Intensive Care Society APACHE II study
116
Hospital risk of death
100%
80%
60%
40%
20%
0%
0 20 40 60 80 100 120 140 160
First day APACHE III score
S SDH Sepsis BACT PNEUM S GI PERF
FIGURE 13-4. The influence of the choice of a single disease category for the prediction of hospital risk of death in APACHE III. Relationship between APACHE III score and predicted risk of
hospital death for patients with postoperative subdural hematomas (S SDH), sepsis (other than urinary tract), bacterial pneumonia (BACT PNEUM), and postoperative gastrointestinal perforation
(S GI PERF). The same APACHE III score can lead to different estimated hospital risk of death, depending on the choice of main diagnosis. (Reproduced with permission from Knaus WA, Wagner
DP, Draper EA, et al. The APACHE III prognostic system. Risk prediction of hospital mortality for critically ill hospitalized adults. Chest. December 1991;100(6):1619-1636.)
Section01.indd 94 1/22/2015 9:37:29 AM