
Page 385 - Hall et al (2015) Principles of Critical Care-McGraw-Hill
P. 385
CHAPTER 33: Shock 255
150 150
100 100
LV Pressure LV Pressure
50 50
0
0 50 100 150 0 0 50 100 150
LV Volume
LV Volume
12
12
10
10
8 8 Septic shock,
Cardiac output 6 4 Normal Cardiogenic shock Cardiac output 6 Normal
compliant ventricle
diastolic stiffness
2 4 Septic shock,
2
0
−5 0 5 10 15 20 25
End–diastolic pressure 0 −5 0 5 10 15 20 25
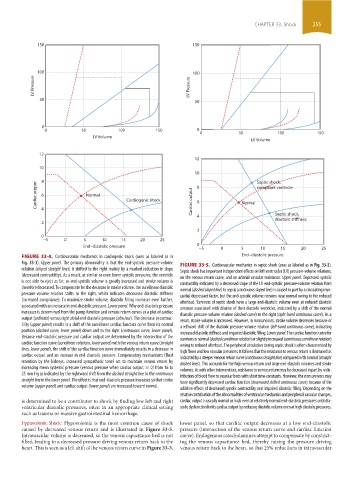
FIGURE 33-4. Cardiovascular mechanics in cardiogenic shock (axes as labeled as in End–diastolic pressure
Fig. 33-3). Upper panel. The primary abnormality is that the end-systolic pressure-volume FIGURE 33-5. Cardiovascular mechanics in septic shock (axes as labeled as in Fig. 33-3).
relation (sloped straight lines) is shifted to the right mainly by a marked reduction in slope Septic shock has important independent effects on left ventricular (LV) pressure-volume relations,
(decreased contractility). As a result, at similar or even lower systolic pressures, the ventricle on the venous return curve, and on arterial vascular resistance. Upper panel. Depressed systolic
is not able to eject as far, so end-systolic volume is greatly increased and stroke volume is contractility indicated by a decreased slope of the LV end-systolic pressure-volume relation from
therefore decreased. To compensate for the decrease in stroke volume, the curvilinear diastolic normal (dashed sloped line) to sepsis (continuous sloped line) is caused in part by a circulating myo-
pressure-volume relation shifts to the right, which indicates decreased diastolic stiffness cardial depressant factor, but the end-systolic volume remains near normal owing to the reduced
(increased compliance). To maximize stroke volume, diastolic filling increases even further, afterload. Survivors of septic shock have a large end-diastolic volume even at reduced diastolic
associated with an increase in end-diastolic pressure. Lower panel. Why end-diastolic pressure pressure associated with dilation of their diastolic ventricles, indicated by a shift of the normal
increases is determined from the pump function and venous return curves as a plot of cardiac diastolic pressure-volume relation (dashed curve) to the right (right-hand continuous curve). As a
output (ordinate) versus right atrial end-diastolic pressure (abscissa). The decrease in contrac- result, stroke volume is increased. However, in nonsurvivors, stroke volume decreases because of
tility (upper panel) results in a shift of the curvilinear cardiac function curve from its normal a leftward shift of the diastolic pressure-volume relation (left-hand continuous curve), indicating
position (dashed curve, lower panel) down and to the right (continuous curve, lower panel). increased diastolic stiffness and impaired diastolic filling. Lower panel. The cardiac function curve for
Because end-diastolic pressure and cardiac output are determined by the intersection of the survivors is normal (dashed curvilinear relation) or slightly increased (continuous curvilinear relation)
cardiac function curve (curvilinear relations, lower panel) with the venous return curve (straight owing to reduced afterload. The peripheral circulation during septic shock is often characterized by
lines, lower panel), the shift of the cardiac function curve immediately results in a decrease in high flows and low vascular pressures. It follows that the resistance to venous return is decreased as
cardiac output and an increase in end-diastolic pressure. Compensatory mechanisms (fluid indicated by a steeper venous return curve (continuous straight line) compared with normal (straight
retention by the kidneys, increased sympathetic tone) act to maintain venous return by dashed lines). This accounts for the high venous return and large end-diastolic volumes and stroke
increasing mean systemic pressure (venous pressure when cardiac output = 0) from 16 to volumes. As with other interventions, resistance to venous return may be decreased in part by redis-
25 mm Hg as indicated by the rightward shift from the dashed straight line to the continuous tribution of blood flow to vascular beds with short time constants. However, the nonsurvivors may
straight line in the lower panel. The effect is that end-diastolic pressure increases so that stroke have significantly depressed cardiac function (downward shifted continuous curve) because of the
volume (upper panel) and cardiac output (lower panel) are increased toward normal.
additive effects of decreased systolic contractility and impaired diastolic filling. Depending on the
relative contribution of the abnormalities of ventricular mechanics and peripheral vascular changes,
is determined to be a contributor to shock by finding low left and right cardiac output is usually normal or high even at relatively normal end-diastolic pressures until dia-
ventricular diastolic pressures, often in an appropriate clinical setting stolic dysfunction limits cardiac output by reducing diastolic volume even at high diastolic pressures.
such as trauma or massive gastrointestinal hemorrhage.
Hypovolemic Shock: Hypovolemia is the most common cause of shock lower panel, so that cardiac output decreases at a low end-diastolic
caused by decreased venous return and is illustrated in Figure 33-3. pressure (intersection of the venous return curve and cardiac function
Intravascular volume is decreased, so the venous capacitance bed is not curve). Endogenous catecholamines attempt to compensate by constrict-
filled, leading to a decreased pressure driving venous return back to the ing the venous capacitance bed, thereby raising the pressure driving
heart. This is seen as a left shift of the venous return curve in Figure 33-3, venous return back to the heart, so that 25% reductions in intravascular
section03.indd 255 1/23/2015 2:06:56 PM