Page 566 - Clinical Application of Mechanical Ventilation
P. 566

532    Chapter 16


                                             Early signs of weaning failure include tachypnea, use of accessory muscles, and
                          Patients may hyperven-  paradoxical abdominal movements (Cohen et al., 1982). It is important to evalu-
                        tilate due to hypoxia, pain,
                        anxiety, or inappropriate ven-  ate and apply clinical data in conjuction with the patient’s clinical presentations.
                        tilator settings. It is a grave   Patients may hyperventilate due to hypoxia, pain, anxiety, or inappropriate ventila-
                        mistake to reduce ventilatory
                        support simply because the   tor settings. It is a grave mistake to reduce ventilatory support simply because the
                        PaCO 2  shows hyperventilation.  PaCO  shows hyperventilation.
                                                 2
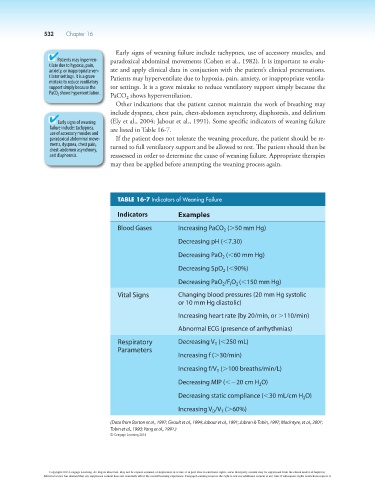
                                             Other indications that the patient cannot maintain the work of breathing may
                                            include dyspnea, chest pain, chest-abdomen asynchrony, diaphoresis, and delirium
                           Early signs of weaning   (Ely et al., 2004; Jabour et al., 1991). Some specific indicators of weaning failure
                        failure include: tachypnea,   are listed in Table 16-7.
                        use of accessory muscles and
                        paradoxical abdominal move-  If the patient does not tolerate the weaning procedure, the patient should be re-
                        ments, dyspnea, chest pain,   turned to full ventilatory support and be allowed to rest. The patient should then be
                        chest-abdomen asynchrony,
                        and diaphoresis.    reassessed in order to determine the cause of weaning failure. Appropriate therapies
                                            may then be applied before attempting the weaning process again.


                                              TABLE 16-7 Indicators of Weaning Failure

                                              Indicators          Examples

                                              Blood Gases         Increasing PaCO  (.50 mm Hg)
                                                                                 2
                                                                  Decreasing pH (,7.30)
                                                                  Decreasing PaO  (,60 mm Hg)
                                                                                2
                                                                  Decreasing SpO  (,90%)
                                                                                2
                                                                  Decreasing PaO /F O (,150 mm Hg)
                                                                                     2
                                                                                2
                                                                                   I
                                              Vital Signs         Changing blood pressures (20 mm Hg systolic
                                                                  or 10 mm Hg diastolic)
                                                                  Increasing heart rate (by 20/min, or .110/min)
                                                                  Abnormal ECG (presence of arrhythmias)

                                              Respiratory         Decreasing V  (,250 mL)
                                                                              T
                                              Parameters
                                                                  Increasing f (.30/min)
                                                                  Increasing f/V  (.100 breaths/min/L)
                                                                              T
                                                                  Decreasing MIP (,220 cm H O)
                                                                                            2
                                                                  Decreasing static compliance (,30 mL/cm H O)
                                                                                                           2
                                                                  Increasing V /V  (.60%)
                                                                             D
                                                                                T
                                            (Data from Burton et al., 1997; Girault et al., 1994; Jabour et al., 1991; Jubran & Tobin, 1997; MacIntyre, et al., 2001;
                                            Tobin et al., 1990; Yang et al., 1991.)
                                            © Cengage Learning 2014


                        Copyright 2013 Cengage Learning. All Rights Reserved. May not be copied, scanned, or duplicated, in whole or in part. Due to electronic rights, some third party content may be suppressed from the eBook and/or eChapter(s).
                      Editorial review has deemed that any suppressed content does not materially affect the overall learning experience. Cengage Learning reserves the right to remove additional content at any time if subsequent rights restrictions require it.
   561   562   563   564   565   566   567   568   569   570   571