
Page 355 - ACCCN's Critical Care Nursing
P. 355
332 P R I N C I P L E S A N D P R A C T I C E O F C R I T I C A L C A R E including haemoglobin. The dissolved carbon dioxide
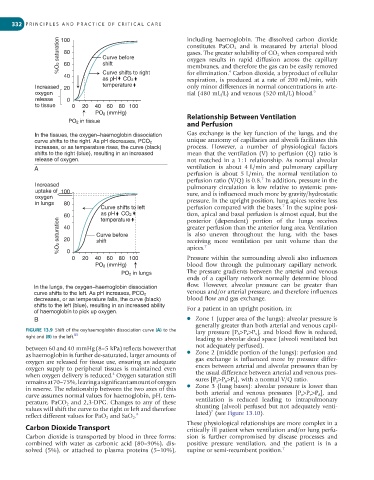
%O 2 saturation 80 Curve before constitutes PaCO 2 and is measured by arterial blood
100
gases. The greater solubility of CO 2 when compared with
oxygen results in rapid diffusion across the capillary
shift
60
4
for elimination. Carbon dioxide, a byproduct of cellular
40 Curve shifts to right membranes, and therefore the gas can be easily removed
as pH CO 2 respiration, is produced at a rate of 200 mL/min, with
Increased 20 temperature only minor differences in normal concentrations in arte-
oxygen rial (480 mL/L) and venous (520 mL/L) blood. 9
release 0
to tissue 0 20 40 60 80 100
PO 2 (mmHg)
PO 2 in tissue Relationship Between Ventilation
and Perfusion
In the tissues, the oxygen–haemoglobin dissociation Gas exchange is the key function of the lungs, and the
curve shifts to the right. As pH decreases, PCO 2 unique anatomy of capillaries and alveoli facilitates this
increases, or as temperature rises, the curve (black) process. However, a number of physiological factors
shifts to the right (blue), resulting in an increased mean that the ventilation (V) to perfusion (Q) ratio is
release of oxygen. not matched in a 1 : 1 relationship. As normal alveolar
A ventilation is about 4 L/min and pulmonary capillary
perfusion is about 5 L/min, the normal ventilation to
7
perfusion ratio (V/Q) is 0.8. In addition, pressure in the
Increased pulmonary circulation is low relative to systemic pres-
uptake of 100 sure, and is influenced much more by gravity/hydrostatic
oxygen
in lungs 80 pressure. In the upright position, lung apices receive less
7
Curve shifts to left perfusion compared with the bases. In the supine posi-
60 as pH CO 2 tion, apical and basal perfusion is almost equal, but the
temperature
%O 2 saturation 40 Curve before greater perfusion than the anterior lung area. Ventilation
posterior (dependent) portion of the lungs receives
is also uneven throughout the lung, with the bases
20
shift
receiving more ventilation per unit volume than the
7
0
Pressure within the surrounding alveoli also influences
0 20 40 60 80 100 apices.
PO 2 (mmHg) blood flow through the pulmonary capillary network.
PO 2 in lungs The pressure gradients between the arterial and venous
ends of a capillary network normally determine blood
In the lungs, the oxygen–haemoglobin dissociation flow. However, alveolar pressure can be greater than
curve shifts to the left. As pH increases, PCO 2 venous and/or arterial pressure, and therefore influences
decreases, or as temperature falls, the curve (black) blood flow and gas exchange.
shifts to the left (blue), resulting in an increased ability For a patient in an upright position, in:
of haemoglobin to pick up oxygen.
B ● Zone 1 (upper area of the lungs): alveolar pressure is
generally greater than both arterial and venous capil-
FIGURE 13.9 Shift of the oxyhaemoglobin dissociation curve (A) to the lary pressure [P A >P a >P v ], and blood flow is reduced,
85
right and (B) to the left. leading to alveolar dead space (alveoli ventilated but
not adequately perfused).
between 60 and 40 mmHg (8–5 kPa) reflects however that
as haemoglobin is further de-saturated, larger amounts of ● Zone 2 (middle portion of the lungs): perfusion and
oxygen are released for tissue use, ensuring an adequate gas exchange is influenced more by pressure differ-
oxygen supply to peripheral tissues is maintained even ences between arterial and alveolar pressures than by
4
when oxygen delivery is reduced. Oxygen saturation still the usual difference between arterial and venous pres-
remains at 70–75%, leaving a significant amount of oxygen sures [P a >P A >P v ], with a normal V/Q ratio.
in reserve. The relationship between the two axes of this ● Zone 3 (lung bases): alveolar pressure is lower than
curve assumes normal values for haemoglobin, pH, tem- both arterial and venous pressures [P a >P v >P A ], and
perature, PaCO 2 and 2,3-DPG. Changes to any of these ventilation is reduced leading to intrapulmonary
values will shift the curve to the right or left and therefore shunting (alveoli perfused but not adequately venti-
7
reflect different values for PaO 2 and SaO 2 . 8 lated) (see Figure 13.10).
These physiological relationships are more complex in a
Carbon Dioxide Transport critically ill patient when ventilation and/or lung perfu-
Carbon dioxide is transported by blood in three forms: sion is further compromised by disease processes and
combined with water as carbonic acid (80–90%), dis- positive pressure ventilation, and the patient is in a
solved (5%), or attached to plasma proteins (5–10%), supine or semi-recumbent position. 7