
Page 422 - ACCCN's Critical Care Nursing
P. 422
Ventilation and Oxygenation Management 399
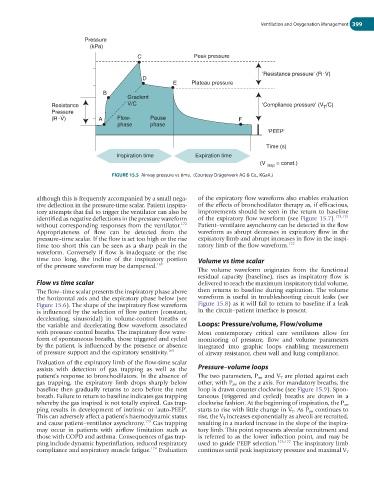
Pressure
(kPa)
C Peak pressure
.
.
‘Resistance pressure’ (R V)
D
E Plateau pressure
B
Gradient
.
Resistance V/C ‘Compliance pressure’ (V /C)
T
Pressure
.
.
(R V) A Flow- Pause F
phase phase
‘PEEP’
Time (s)
Inspiration time Expiration time
(V insp = const.)
FIGURE 15.5 Airway pressure vs time. (Courtesy Drägerwerk AG & Co., KGaA.)
although this is frequently accompanied by a small nega- of the expiratory flow waveform also enables evaluation
tive deflection in the pressure-time scalar. Patient inspira- of the effects of bronchodilator therapy as, if efficacious,
tory attempts that fail to trigger the ventilator can also be improvements should be seen in the return to baseline
identified as negative deflections in the pressure waveform of the expiratory flow waveform (see Figure 15.7). 173,175
without corresponding responses from the ventilator. 172 Patient–ventilator asynchrony can be detected in the flow
Appropriateness of flow can be detected from the waveform as abrupt decreases in expiratory flow in the
pressure–time scalar. If the flow is set too high or the rise expiratory limb and abrupt increases in flow in the inspi-
time too short this can be seen as a sharp peak in the ratory limb of the flow waveform. 172
waveform. Conversely if flow is inadequate or the rise
time too long, the incline of the inspiratory portion Volume vs time scalar
of the pressure waveform may be dampened. 169
The volume waveform originates from the functional
residual capacity (baseline), rises as inspiratory flow is
Flow vs time scalar delivered to reach the maximum inspiratory tidal volume,
The flow–time scalar presents the inspiratory phase above then returns to baseline during expiration. The volume
the horizontal axis and the expiratory phase below (see waveform is useful in troubleshooting circuit leaks (see
Figure 15.6). The shape of the inspiratory flow waveform Figure 15.8) as it will fail to return to baseline if a leak
is influenced by the selection of flow pattern (constant, in the circuit–patient interface is present.
decelerating, sinusoidal) in volume-control breaths or
the variable and decelerating flow waveform associated Loops: Pressure/volume, Flow/volume
with pressure-control breaths. The inspiratory flow wave- Most contemporary critical care ventilators allow for
form of spontaneous breaths, those triggered and cycled monitoring of pressure, flow and volume parameters
by the patient, is influenced by the presence or absence integrated into graphic loops enabling measurement
of pressure support and the expiratory sensitivity. 169 of airway resistance, chest wall and lung compliance.
Evaluation of the expiratory limb of the flow-time scalar
assists with detection of gas trapping as well as the Pressure–volume loops
patient’s response to bronchodilators. In the absence of The two parameters, P aw and V T are plotted against each
gas trapping, the expiratory limb drops sharply below other, with P aw on the x axis. For mandatory breaths, the
baseline then gradually returns to zero before the next loop is drawn counter clockwise (see Figure 15.9). Spon-
breath. Failure to return to baseline indicates gas trapping taneous (triggered and cycled) breaths are drawn in a
whereby the gas inspired is not totally expired. Gas trap- clockwise fashion. At the beginning of inspiration, the P aw
ping results in development of intrinsic or ‘auto-PEEP’. starts to rise with little change in V T . As P aw continues to
This can adversely affect a patient’s haemodynamic status rise, the V T increases exponentially as alveoli are recruited,
and cause patient–ventilator asynchrony. 173 Gas trapping resulting in a marked increase in the slope of the inspira-
may occur in patients with airflow limitation such as tory limb. This point represents alveolar recruitment and
those with COPD and asthma. Consequences of gas trap- is referred to as the lower inflection point, and may be
ping include dynamic hyperinflation, reduced respiratory used to guide PEEP selection. 176,177 The inspiratory limb
compliance and respiratory muscle fatigue. 174 Evaluation continues until peak inspiratory pressure and maximal V T