
Page 2453 - Hematology_ Basic Principles and Practice ( PDFDrive )
P. 2453
Chapter 150 Disorders of Coagulation in the Neonate 2191
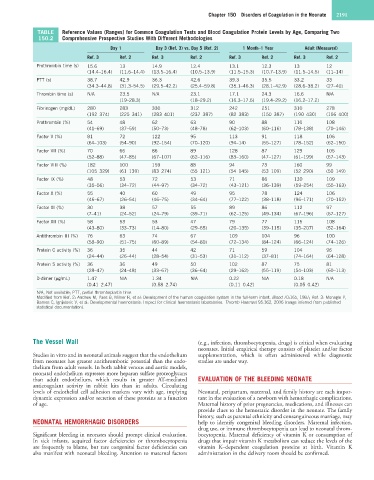
TABLE Reference Values (Ranges) for Common Coagulation Tests and Blood Coagulation Protein Levels by Age, Comparing Two
150.2 Comprehensive Prospective Studies With Different Methodologies
Day 1 Day 3 (Ref. 3) vs. Day 5 (Ref. 2) 1 Month–1 Year Adult (Measured)
Ref. 3 Ref. 2 Ref. 3 Ref. 2 Ref. 3 Ref. 2 Ref. 3 Ref. 2
Prothrombin time (s) 15.6 13 14.9 12.4 13.1 12.3 13 12
(14.4–16.4) (11.6–14.4) (13.5–16.4) (10.5–13.9) (11.5–15.3) (10.7–13.9) (11.5–14.5) (11–14)
PTT (s) 38.7 42.9 36.3 42.6 39.3 35.5 33.2 33
(34.3–44.8) (31.3–54.5) (29.5–42.2) (25.4–59.8) (35.1–46.3) (28.1–42.9) (28.6–38.2) (27–40)
Thrombin time (s) N/A 23.5 N/A 23.1 17.1 24.3 16.6 N/A
(19–28.3) (18–29.2) (16.3–17.6) (19.4–29.2) (16.2–17.2)
Fibrinogen (mg/dL) 280 283 330 312 242 251 310 278
(192–374) (225–341) (283–401) (237–387) (82–383) (150–387) (190–430) (156–400)
Prothrombin (%) 54 48 62 63 90 88 110 108
(41–69) (37–59) (50–73) (48–78) (62–103) (60–116) (78–138) (70–146)
Factor V (%) 81 72 122 95 113 91 118 106
(64–103) (54–90) (92–154) (70–120) (94–14) (55–127) (78–152) (62–150)
Factor VII (%) 70 66 86 89 128 87 129 105
(52–88) (47–85) (67–107) (62–116) (83–160) (47–127) (61–199) (67–143)
Factor VIII (%) 182 100 159 88 94 73 160 99
(105–329) (61–139) (83–274) (55–121) (54–145) (53–109) (52–290) (50–149)
Factor IX (%) 48 53 72 53 71 86 130 109
(35–56) (34–72) (44–97) (34–72) (43–121) (36–139) (59–254) (55–163)
Factor X (%) 55 40 60 49 95 78 124 106
(46–67) (26–54) (46–75) (34–64) (77–122) (38–118) (96–171) (70–152)
Factor XI (%) 30 38 57 55 89 86 112 97
(7–41) (24–52) (24–79) (39–71) (62–125) (49–134) (67–196) (67–127)
Factor XII (%) 58 53 53 47 79 77 115 108
(43–80) (33–73) (14–80) (29–65) (20–135) (39–115) (35–207) (52–164)
Antithrombin III (%) 76 63 74 67 109 104 96 100
(58–90) (51–75) (60–89) (54–80) (72–134) (84–124) (66–124) (74–126)
Protein C activity (%) 36 35 44 42 71 59 104 96
(24–44) (26–44) (28–54) (31–53) (31–112) (37–81) (74–164) (64–128)
Protein S activity (%) 36 36 49 50 102 87 75 81
(28–47) (24–48) (33–67) (36–64) (29–162) (55–119) (54–103) (60–113)
D-dimer (µg/mL) 1.47 N/A 1.34 N/A 0.22 N/A 0.18 N/A
(0.41–2.47) (0.58–2.74) (0.11–0.42) (0.05–0.42)
N/A, Not available; PTT, partial thromboplastin time.
Modified from Ref. 2: Andrew M, Paes B, Milner R, et al: Development of the human coagulation system in the full-term infant. Blood 70:165, 1987; Ref. 3: Monagle P,
Barnes C, Ignjatovic V, et al: Developmental haemostasis: Impact for clinical haemostasis laboratories. Thromb Haemost 95:362, 2006 (range inferred from published
statistical documentation).
The Vessel Wall (e.g., infection, thrombocytopenia, drugs) is critical when evaluating
neonates. Initial empirical therapy consists of platelet and/or factor
Studies in vitro and in neonatal animals suggest that the endothelium supplementation, which is often administered while diagnostic
from neonates has greater antithrombotic potential than the endo- studies are under way.
thelium from adult vessels. In both rabbit venous and aortic models,
neonatal endothelium expresses more heparan sulfate proteoglycans
than adult endothelium, which results in greater AT-mediated EVALUATION OF THE BLEEDING NEONATE
anticoagulant activity in rabbit kits than in adults. Circulating
levels of endothelial cell adhesion markers vary with age, implying Neonatal, peripartum, maternal, and family history are each impor-
dynamic expression and/or secretion of these proteins as a function tant in the evaluation of a newborn with hemorrhagic complications.
of age. Maternal history of prior pregnancies, medications, and illnesses can
provide clues to the hemostatic disorder in the neonate. The family
history, such as parental ethnicity and consanguineous marriage, may
NEONATAL HEMORRHAGIC DISORDERS help to identify congenital bleeding disorders. Maternal infection,
drug use, or immune thrombocytopenia can lead to neonatal throm-
Significant bleeding in neonates should prompt clinical evaluation. bocytopenia. Maternal deficiency of vitamin K or consumption of
In sick infants, acquired factor deficiencies or thrombocytopenia drugs that impair vitamin K metabolism can reduce the levels of the
are frequently to blame, but rare congenital factor deficiencies can vitamin K–dependent coagulation proteins at birth. Vitamin K
also manifest with neonatal bleeding. Attention to maternal factors administration in the delivery room should be confirmed.