
Page 2639 - Hematology_ Basic Principles and Practice ( PDFDrive )
P. 2639
e20 Part XIII Consultative Hematology
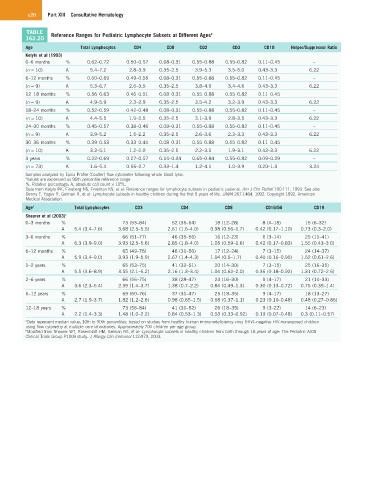
TABLE a
162.20 Reference Ranges for Pediatric Lymphocyte Subsets at Different Ages
Age Total Lymphocytes CD4 CD8 CD2 CD3 CD19 Helper/Suppressor Ratio
Kotylo et al (1993)
0–6 months % 0.62–0.72 0.50–0.57 0.08–0.31 0.55–0.88 0.55–0.82 0.11–0.45 –
(n = 10) A 5.4–7.2 2.8–3.9 0.35–2.5 3.9–5.3 3.5–5.0 0.43–3.3 6.22
6–12 months % 0.60–0.69 0.49–0.55 0.08–0.31 0.55–0.88 0.55–0.82 0.11–0.45 –
(n = 9) A 5.3–6.7 2.6–3.5 0.35–2.5 3.8–4.9 3.4–4.6 0.43–3.3 6.22
12–18 months % 0.56–0.63 0.46–0.51 0.08–0.31 0.55–0.88 0.55–0.82 0.11–0.45 –
(n = 9) A 4.9–5.9 2.3–2.9 0.35–2.5 3.5–4.2 3.2–3.9 0.43–3.3 6.22
18–24 months % 0.52–0.59 0.42–0.48 0.08–0.31 0.55–0.88 0.55–0.82 0.11–0.45 –
(n = 10) A 4.4–5.5 1.9–2.5 0.35–2.5 3.1–3.9 2.8–3.5 0.43–3.3 6.22
24–30 months % 0.45–0.57 0.38–0.46 0.08–0.31 0.55–0.88 0.55–0.82 0.11–0.45 –
(n = 9) A 3.9–5.2 1.5–2.2 0.35–2.5 2.6–3.6 2.3–3.3 0.43–3.3 6.22
30–36 months % 0.39–0.53 0.33–0.44 0.08–0.31 0.55–0.88 0.55–0.82 0.11–0.45 –
(n = 10) A 3.3–5.1 1.2–2.0 0.35–2.5 2.2–3.5 1.9–3.1 0.43–3.3 6.22
3 years % 0.22–0.69 0.27–0.57 0.14–0.34 0.65–0.84 0.55–0.82 0.09–0.29 –
(n = 73) A 1.6–5.4 0.56–2.7 0.33–1.4 1.2–4.1 1.0–3.9 0.20–1.3 3.24
Samples analyzed by Epics Profile (Coulter) flow cytometer following whole blood lysis.
a Values are expressed as 95th percentile reference range.
9
%, Relative percentage; A, absolute cell count × 10 /L.
Data from Kotylo PK, Fineberg NS, Freeman KS, et al: Reference ranges for lymphocyte subsets in pediatric patients. Am J Clin Pathol 100:111, 1993. See also
Denny T, Yogev R, Gelman R, et al: Lymphocyte subsets in healthy children during the first 5 years of life. JAMA 267:1484, 1992. Copyright 1992, American
Medical Association.
Age a Total Lymphocytes CD3 CD4 CD8 CD16/56 CD19
Shearer et al (2003) b
0–3 months % 73 (53–84) 52 (35–64) 18 (12–28) 8 (4–18) 15 (6–32)
A 5.4 (3.4–7.6) 3.68 (2.5–5.5) 2.61 (1.6–4.0) 0.98 (0.56–1.7) 0.42 (0.17–1.10) 0.73 (0.3–2.0)
3–6 months % 66 (51–77) 46 (35–56) 16 (12–23) 6 (3–14) 25 (11–41)
A 6.3 (3.9–9.0) 3.93 (2.5–5.6) 2.85 (1.8–4.0) 1.05 (0.59–1.6) 0.42 (0.17–0.83) 1.55 (0.43–3.0)
6–12 months % 65 (49–76) 46 (31–56) 17 (12–24) 7 (3–15) 24 (14–37)
A 5.9 (3.4–9.0) 3.93 (1.9–5.9) 2.67 (1.4–4.3) 1.04 (0.5–1.7) 0.40 (0.16–0.95) 1.52 (0.61–2.6)
1–2 years % 65 (53–75) 41 (32–51) 20 (14–30) 7 (3–15) 25 (16–35)
A 5.5 (3.6–8.9) 3.55 (2.1–6.2) 2.16 (1.3–3.4) 1.04 (0.62–2.0) 0.36 (0.18–0.92) 1.31 (0.72–2.6)
2–6 years % 66 (56–75) 38 (28–47) 23 (16–30) 9 (4–17) 21 (14–33)
A 3.6 (2.3–5.4) 2.39 (1.4–3.7) 1.38 (0.7–2.2) 0.84 (0.49–1.3) 0.30 (0.13–0.72) 0.75 (0.39–1.4)
6–12 years % 69 (60–76) 37 (31–47) 25 (18–35) 9 (4–17) 18 (13–27)
A 2.7 (1.9–3.7) 1.82 (1.2–2.6) 0.98 (0.65–1.5) 0.68 (0.37–1.1) 0.23 (0.10–0.48) 0.48 (0.27–0.86)
12–18 years % 73 (56–84) 41 (31–52) 26 (18–35) 9 (3–22) 14 (6–23)
A 2.2 (1.4–3.3) 1.48 (1.0–2.2) 0.84 (0.53–1.3) 0.53 (0.33–0.92) 0.19 (0.07–0.48) 0.3 (0.11–0.57)
a Data represent median value, 10th to 90th percentiles; based on studies from healthy human immunodeficiency virus (HIV)–negative HIV-nonexposed children
using flow cytometry at multiple core laboratories. Approximately 700 children per age group.
b Modified from Shearer WT, Rosenblatt HM, Gelman RS, et al: Lymphocyte subsets in healthy children from birth through 18 years of age: The Pediatric AIDS
Clinical Trials Group P1009 study. J Allergy Clin Immunol 112:973, 2003.