
Page 475 - Hematology_ Basic Principles and Practice ( PDFDrive )
P. 475
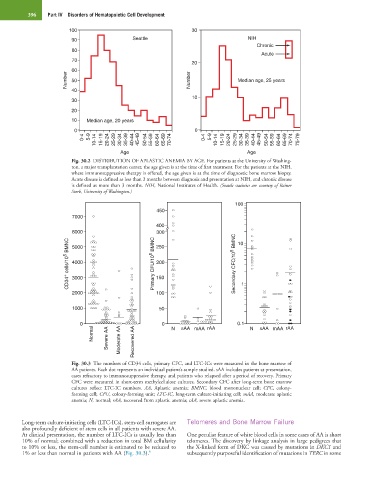
396    Part IV  Disorders of Hematopoietic Cell Development


                        100                                     30
                        90                  Seattle                               NIH
                                                                                     Chronic
                        80
                                                                                       Acute
                        70
                                                                20
                        60
                       Number  50                              Number          Median age, 25 years

                        40
                                                                10
                        30
                        20
                        10   Median age, 20 years
                         0                                       0
                            0-4  5-9  10-14  15-19  20-24  25-29  30-34  35-39  40-44  45-49  50-54  55-59  60-64  65-69  70-74  0-4  5-9  10-14  15-19  20-24  25-29  30-34  35-39  40-44  45-49  50-54  55-59  60-64  65-69  70-74  75-79

                                        Age                                       Age
                        Fig. 30.2  DISTRIBUTION OF APLASTIC ANEMIA BY AGE. For patients at the University of Washing-
                        ton, a major transplantation center, the age given is at the time of first treatment. For the patients at the NIH,
                        where immunosuppressive therapy is offered, the age given is at the time of diagnostic bone marrow biopsy.
                        Acute disease is defined as less than 3 months between diagnosis and presentation at NIH, and chronic disease
                        is defined as more than 3 months. NIH, National Institutes of Health. (Seattle statistics are courtesy of Rainer
                        Storb, University of Washington.)

                                                                              100
                                                    450
                         7000
                                                    400
                         6000                       300                        10
                       CD34 +  cells/10 5  BMNC  4000  Primary CFU/10 5  BMNC  150  Secondary CFC/10 5  BMNC
                         5000
                                                    250
                                                    200

                         3000

                         2000                       100                         1

                         1000                        50

                           0                          0  N  sAA mAA rAA        0.1  N  sAA mAA rAA
                               Normal  Severe AA  Moderate AA  Recovered AA


                        Fig. 30.3  The numbers of CD34 cells, primary CFC, and LTC-ICs were measured in the bone marrow of
                        AA patients. Each dot represents an individual patient’s sample studied. sAA includes patients at presentation,
                        cases refractory to immunosuppressive therapy, and patients who relapsed after a period of recovery. Primary
                        CFC were measured in short-term methylcellulose cultures. Secondary CFC after long-term bone marrow
                        cultures  reflect  LTC-IC  numbers.  AA,  Aplastic  anemia;  BMNC,  blood  mononuclear  cell;  CFC,  colony-
                        forming cell; CFU, colony-forming unit; LTC-IC, long-term culture-initiating cell; mAA, moderate aplastic
                        anemia; N, normal; rAA, recovered from aplastic anemia; sAA, severe aplastic anemia.


        Long-term culture-initiating cells (LTC-ICs), stem-cell surrogates are   Telomeres and Bone Marrow Failure
        also profoundly deficient of stem cells in all patients with severe AA.
        At clinical presentation, the number of LTC-ICs is usually less than   One peculiar feature of white blood cells in some cases of AA is short
        10% of normal; combined with a reduction in total BM cellularity   telomeres. The discovery by linkage analysis in large pedigrees that
        to 10% or less, the stem-cell number is estimated to be reduced to   the X-linked form of DKC was caused by mutations in DKC1 and
        1% or less than normal in patients with AA (Fig. 30.3). 6  subsequently purposeful identification of mutations in TERC in some