
Page 1286 - Clinical Immunology_ Principles and Practice ( PDFDrive )
P. 1286
1248 Part ElEvEn Diagnostic Immunology
No Ag chicken erythrocytes) should be used as an internal reference
10 4 for evaluating DNA content and evaluating the cell cycle
distribution.
It should be noted that several different computer algorithms
10 3 have been developed to determine the relative proportion of
each cell cycle compartment, and the selection of a software
program is not a trivial process. The major instrument manu-
facturers supply cell cycle analysis programs, and third-party
10 2 programs are also available. Generally, the optimal program
should be capable of modeling two or more aneuploid popula-
tions, subtracting debris (particularly if formalin-fixed, paraffin-
embedded [FFPE] archival material is used) and accurately
10 1 estimating S-phase cells. 49,50 The combination of a surface marker
and the cell cycle has been very useful in differentiating normal
IFN-γ cell populations from tumor cell populations. One example is
the use of anti-κ-, anti-λ-, or B-cell reagents to separate the
10 0 aneuploid B-cell clone from the remaining normal, reactive B
10 0 10 1 10 2 10 3 10 4 cells in a lymphoid cell mixture. Another uses cytokeratin as a
marker to distinguish between tumor cells and inflammatory
IL-4 cells.
The other major event that has occurred in cell cycle analysis
M.Tb has been the development of technology using the incorporation
10 4 of bromodeoxyuridine. This thymidine analogue is used to
51
directly determine the percentage of S-phase cells. Additionally,
when used in kinetic studies, it permits determination of indi-
10 3 vidual times for the components of the cell cycle and determina-
tion of the growth fraction. Finally, recent developments have
resulted in the availability of two anticyclin reagents to evaluate
cell cycle transition points in malignant cells. 52
10 2
APOPTOSIS DETECTION
Flow cytometry has become the method of choice for the detection
10 1 and quantification of cellular apoptosis, in part because of its
53
capacity for rapid assessment of a large number of cells and
IFN-γ samples. Many distinct features of an apoptotic cell can be
evaluated by using flow cytometry based on light scatter, plasma
10 0 membrane changes, mitochondrial transmembrane potential,
10 0 10 1 10 2 10 3 10 4
DNA content, and DNA integrity.
The light scattering properties of a cell undergoing pro-
IL-4
+
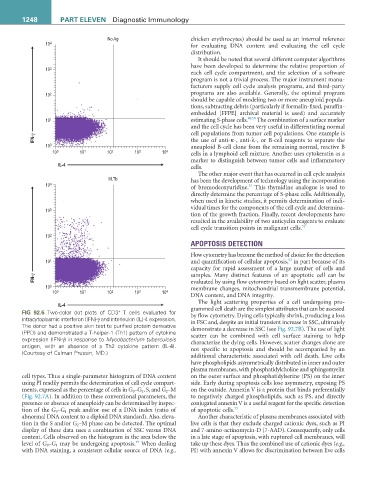
FIG 92.6 Two-color dot plots of CD3 T cells evaluated for grammed cell death are the simplest attributes that can be assessed
intracytoplasmic interferon (IFN)-γ and interleukin (IL)-4 expression. by flow cytometry. Dying cells typically shrink, producing a loss
The donor had a positive skin test to purified protein derivative in FSC and, despite an initial transient increase in SSC, ultimately
(PPD) and demonstrated a T-helper-1 (Th1) pattern of cytokine demonstrate a decrease in SSC (see Fig. 92.7B). The use of light
expression (IFN-γ) in response to Mycobacterium tuberculosis scatter can be combined with cell surface staining to help
antigen, with an absence of a Th2 cytokine pattern (IL-4). characterize the dying cells. However, scatter changes alone are
(Courtesy of Calman Prussin, MD.) not specific to apoptosis and should be accompanied by an
additional characteristic associated with cell death. Live cells
have phospholipids asymmetrically distributed in inner and outer
plasma membranes, with phosphatidylcholine and sphingomyelin
cell types. Thus a single-parameter histogram of DNA content on the outer surface and phosphatidylserine (PS) on the inner
using PI readily permits the determination of cell cycle compart- side. Early during apoptosis cells lose asymmetry, exposing PS
ments, expressed as the percentage of cells in G 0 –G 1 , S, and G 2 –M on the outside. Annexin V is a protein that binds preferentially
(Fig. 92.7A). In addition to these conventional parameters, the to negatively charged phospholipids, such as PS, and directly
presence or absence of aneuploidy can be determined by inspec- conjugated annexin V is a useful reagent for the specific detection
tion of the G 0 –G 1 peak and/or use of a DNA index (ratio of of apoptotic cells. 53
abnormal DNA content to a diploid DNA standard). Also, eleva- Another characteristic of plasma membranes associated with
tion in the S and/or G 2 –M phase can be detected. The optimal live cells is that they exclude charged cationic dyes, such as PI
display of these data uses a combination of SSC versus DNA and 7-amino-actinomycin-D (7-AAD). Consequently, only cells
content. Cells observed on the histogram in the area below the in a late stage of apoptosis, with ruptured cell membranes, will
49
level of G 0–G 1 may be undergoing apoptosis. When dealing take up these dyes. Thus the combined use of cationic dyes (e.g.,
with DNA staining, a consistent cellular source of DNA (e.g., PI) with annexin V allows for discrimination between live cells